In 1995, Sao Paulo, Brasil, a trader and broker named Vicente Nicolellis developed a new trading system.
He was working in a highly volatile market and became interested in using this to his advantage.
His work led him to believe that forex price movements were fundamental to the market’s volatile behaviour. With this in mind, he sought to create a method that would only consider price points.
This led Nicolellis to develop range bars. There was nothing like it at the time. Fast forward to the present day and range bars are becoming more and more popular.
If you’re reading this and thinking, “Wait! Everybody I know uses time-based charts”, don’t follow blindly. Range bars are a tool to make more accurate forex trades.
However, if you replace time-based indicators with range bars, you may very well replace your losses with profit.
Table of Contents
- 1 Calculating Price With Range Bars
- 2 Trading With Range Bars
- 3 Interpreting Volatility With Range Bars
- 4 How A Range Bar Is Built
- 5 When To Use Range Bars
- 6 Range Bar Intervals
- 7 Example Of Range Bars
- 8 Advantages Of Range Bars
- 9 Reasons To Use Range Bars
- 10 Trading Strategies Using Range Bars
- 11 Narrow Range Bar Trading Strategy
- 12 Scalping
- 13 Renko Bars
- 14 Range Bars Vs Renko Bars
- 15 Conclusion
Calculating Price With Range Bars
Most traders and investors are familiar with viewing and using bar charts based on time. For example, a day trader may use 1-hour charts. These, or any other time-based charts, will always display the same number of bars during each trading session, regardless of volatility, volume or any other factor.
On the other hand, range bars can display any number of bars during a trading session.
If the markets are experiencing high volatility, more bars will be shown on the charts. Conversely, if the markets are experiencing low volatility, fewer bars will be shown on the charts.
The number of bars also depends on the currency pair being traded.
In general, there are three main rules to range bars:
- Each range bar must have a high/low range that equals the specified range;
- They must open outside the high/low range of the previous bar;
- Each range bar must close at either its high or its low.
It’s also worth pointing out during periods of low volatility, range bars can take a while to appear on the charts; sometimes up to a few hours.
On the other hand, during periods of high volatility, range bars can be as quick as a few seconds to appear on the charts.
Trading With Range Bars
Here is trendline applied to a range bar chart of the USD/GBP forex pair:
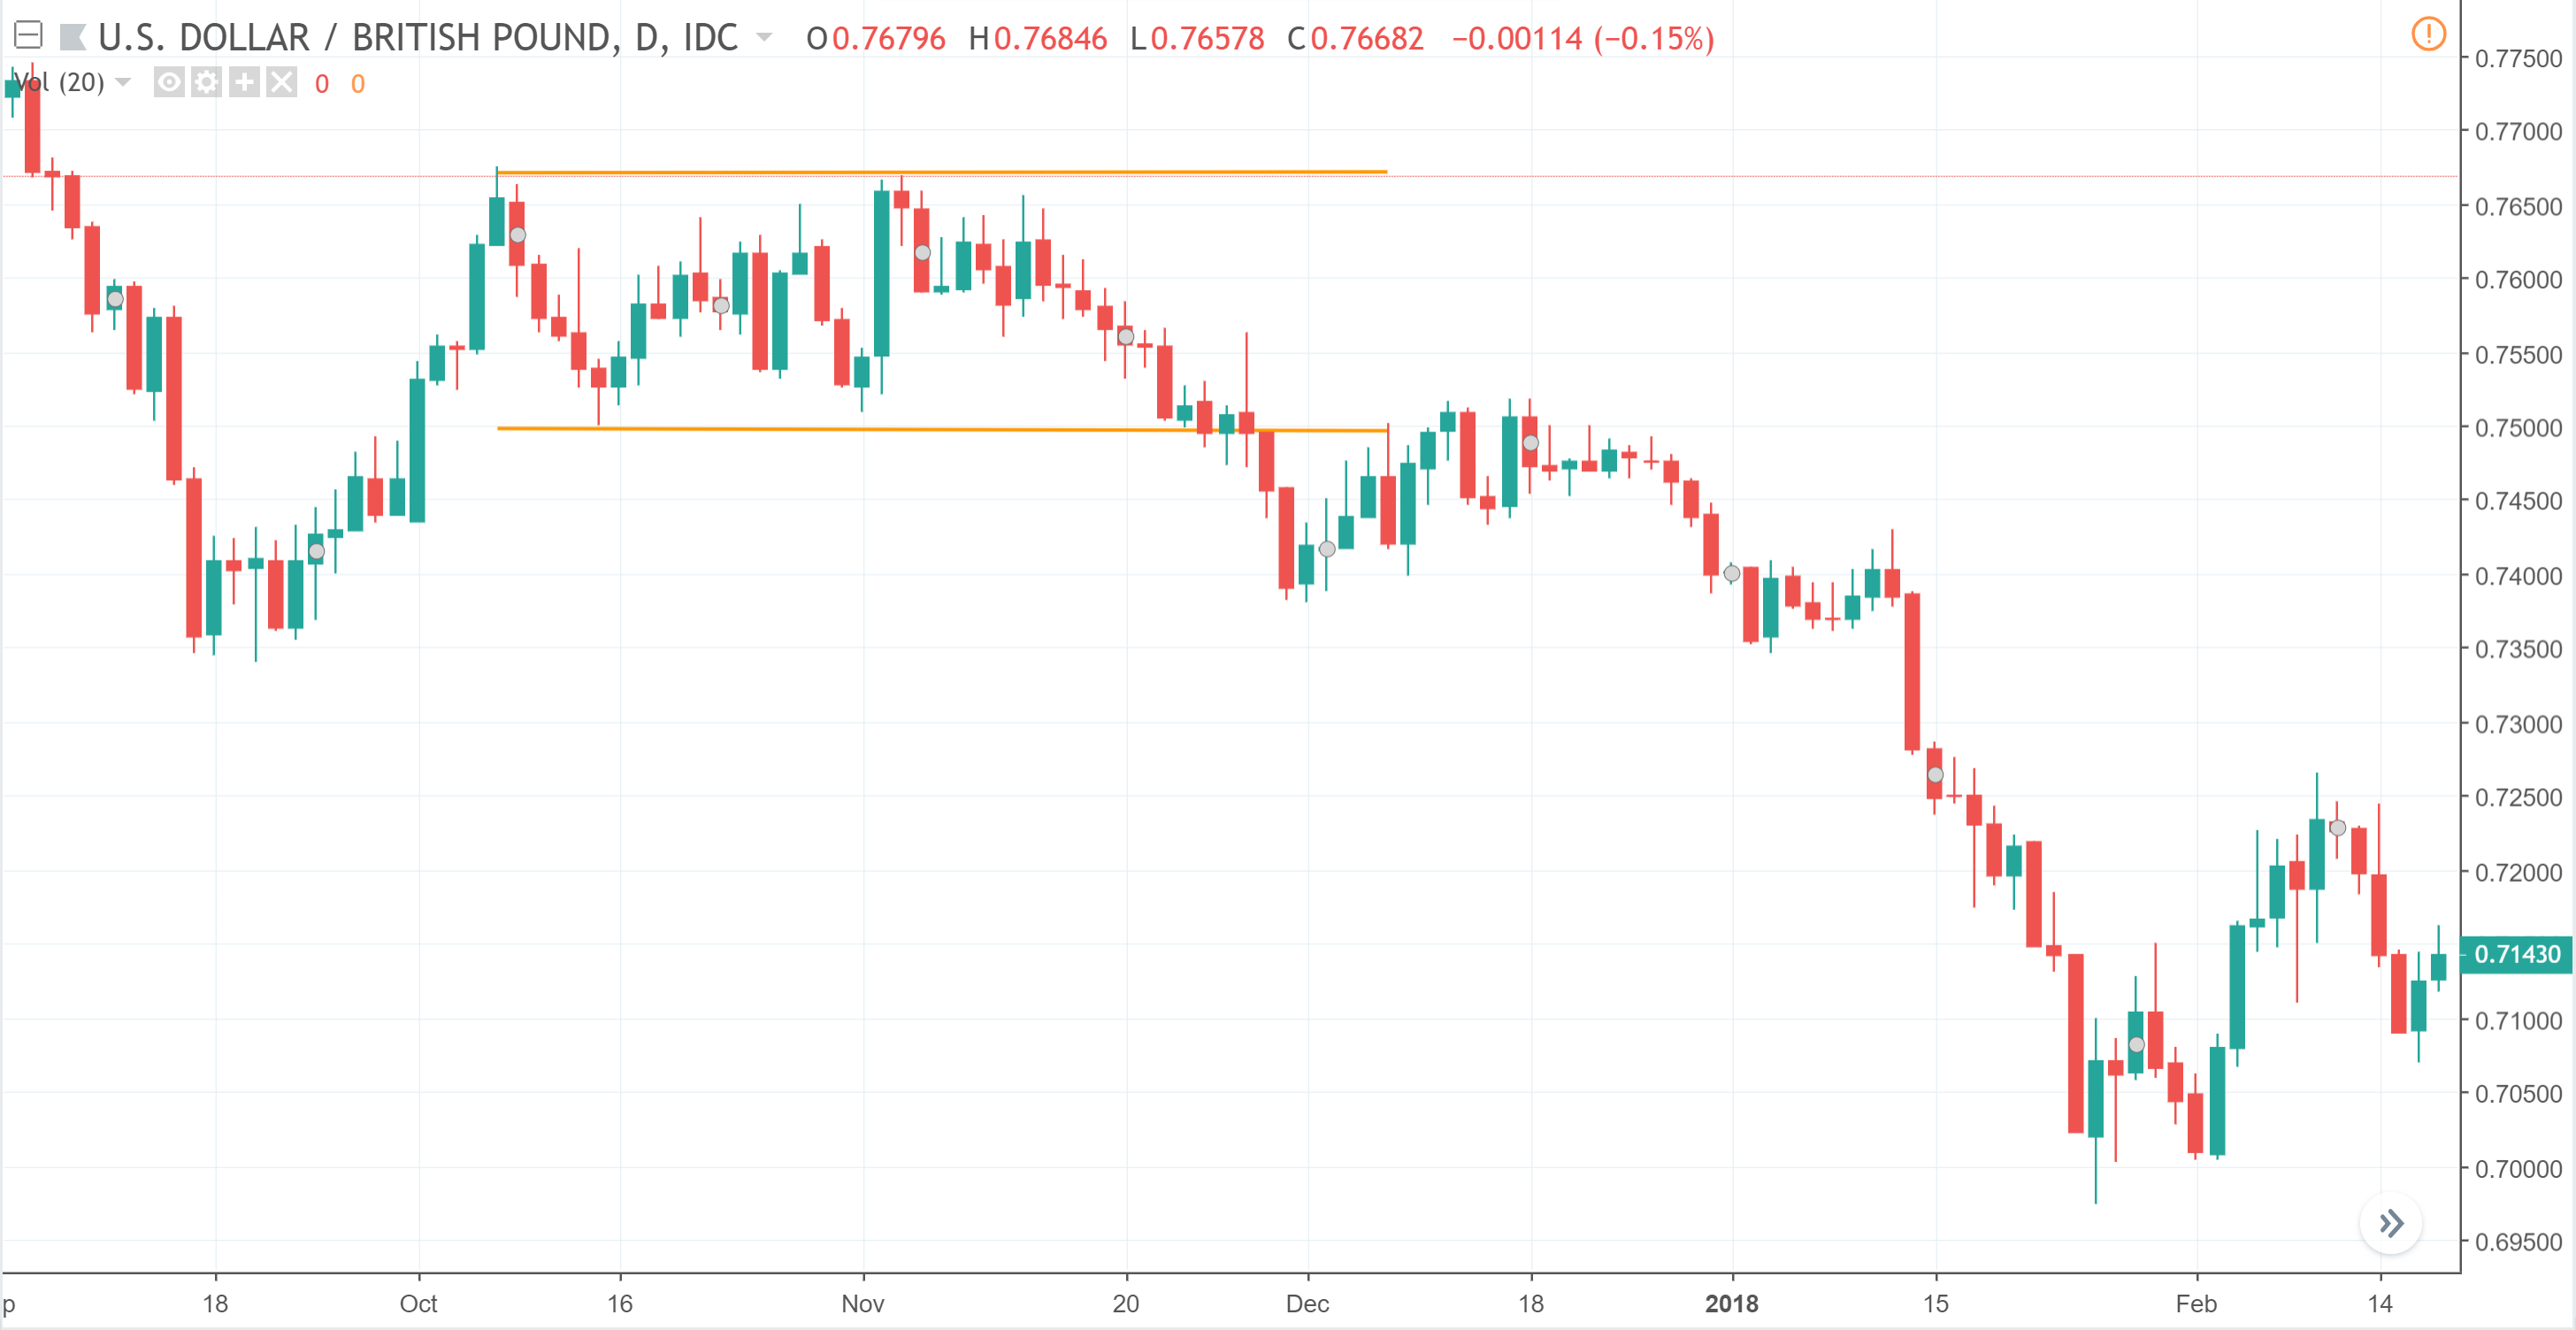
These orange trend lines indicate areas of support and resistance. Once the price broke through, a downtrend followed.
The horizontal trendlines easily display the trading ranges. If the price breaks through, chances are that the movement is strong, as displayed above.
The more that the prices bounce between the range bars, the stronger the move could be once the price eventually breaks through.
This is also true for the bars touching the range bars: the more a trend touches the upper or lower range bars, the greater the potential move once price breaks through.
Here is another example from the GBP/EUR market:
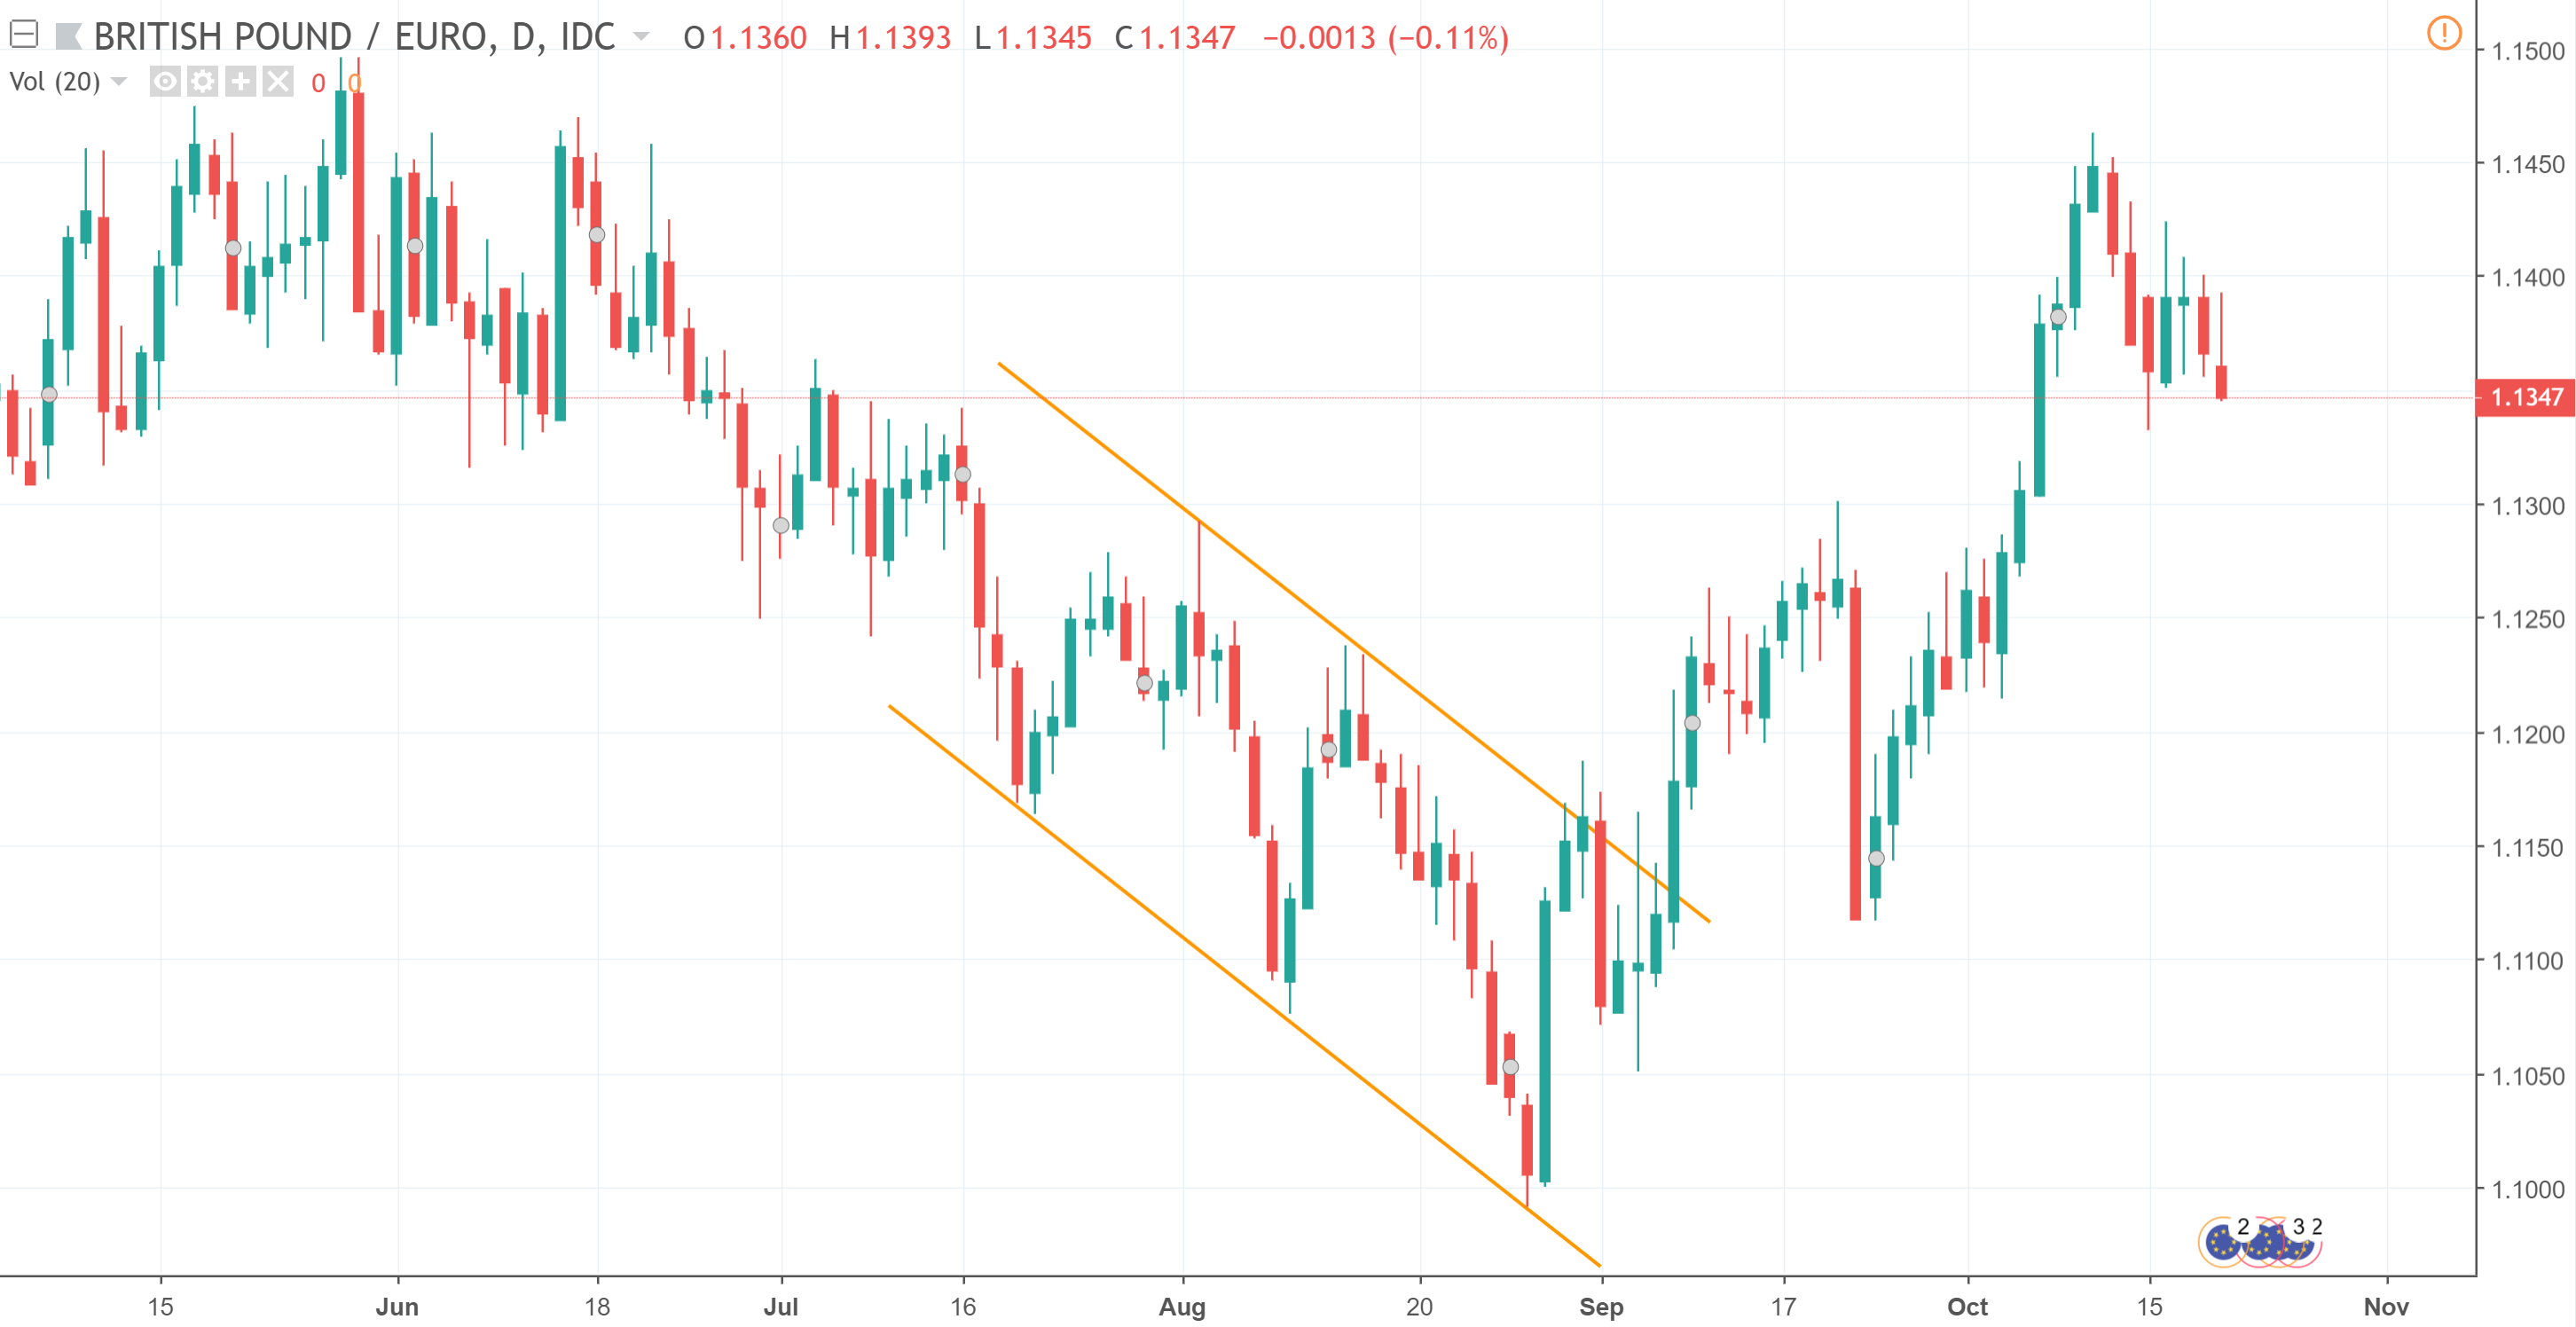
These downward parallel lines create a price channel that, once broken, creates a powerful uptrend relative to the large decreasing price.
Interpreting Volatility With Range Bars
Volatility refers to the amount of uncertainty or risk is created from a change in currency price. The more that the price points fluctuate, the more volatile the market. As markets trade in a narrow range, less range bars print, reflecting decreased volatility. Similarly, as price begins to break out of a trading range with an increase in volatility, more range bars will print.
So, for range bars to become meaningful as a measure of volatility, a trader must spend time observing a particular trading instrument with a specific range bar setting applied. This will enable a trader to notice any subtle changes in the timing of the bars and the frequency in which they print.
Pay attention to the speed of printing: the faster the bars print, the greater the price volatility, and the slower the bars print, the lower the price volatility. Where there is increased volatility in the markets, new trends may be forming, creating new trading opportunities.
How A Range Bar Is Built
As we now know, range bars are driven by price movement. This means that a new range bar can only be created once the specified range has been met.
For example, let’s say our specified range amount is $0.1, so each range bar will have a range (high to low) of $0.1. It would not be uncommon for the range bar to extend over several days if the price’s movement was only within a $0.1 range.
Once a range bar is closed-out, the open of the next range bar will always be at exactly the same price as the close of the prior range bar.
In terms of visualisation, there are no gaps displayed on range bar charts. If there is ever a price gap in the underlying data, ‘virtual bars’ will be inserted as necessary to fill it on the range bar chart. A ‘virtual bar’ is a bar that has no real price activity contained within it.
To distinguish between ‘virtual bars’and ‘real bars’, look at the volume. ‘Virtual bars’ will have their volume up and volume down both at zero.
When To Use Range Bars
This depends on how you trade:
Lower range bars are best used for day or short-term trades as there are less price action and volatility needed before a new range bar appears on the chart.
High range bars are best used for long-term or swing trading as there are more price action and volatility needed before a new range bar appears on the chart.
Range bars can also be highly effective with oscillators such as MACD. By eliminating time and focusing on price alone, the MACD oscillator becomes much more accurate. This also applies to other oscillators, such as Stochastics.
Range Bar Intervals
As a rule, the specified range should be more than the standard oscillation of the underlying data. By selecting too small of a range, a trader will create too many real-time bars when the chart has been built on historical data.
Suppose that within a given five minute period, GBP/USD prices oscillate between 1.5550 and 1.5555, going from 1.5550 to 1.5555, back down to 1.5550 and then back up to 1.5555.
If the range was set to 1, there would be six ‘real bars’, two from 1.5550 to 1.55555, two going back down to 1.5550, and two more going back up to 1.5555,
Now, as all of these oscillations occurred within five minutes of each other (the specified underlying interval in this example) when the range bar chart is built historically, those five minutes would be represented by only two range bars. This is because the bar oscillations within the five minutes would be unavailable when building the chart historically.
An important note to mention here is that the range amount must be greater than the smallest movement of the underlying symbol. It should also be evenly divisible by the minimum move or rounding errors may occur.
The interval setting defines the interval of the data used to build the range bars. The appropriate interval then depends on how to view the market. Traders that invest with a short-term perspective may benefit from using smaller intervals (more precision/noise). On the other hand, traders that invest with a long-term perspective may benefit from larger intervals (less precision/noise).
Example Of Range Bars
Here is what range bars look like in a live setting:
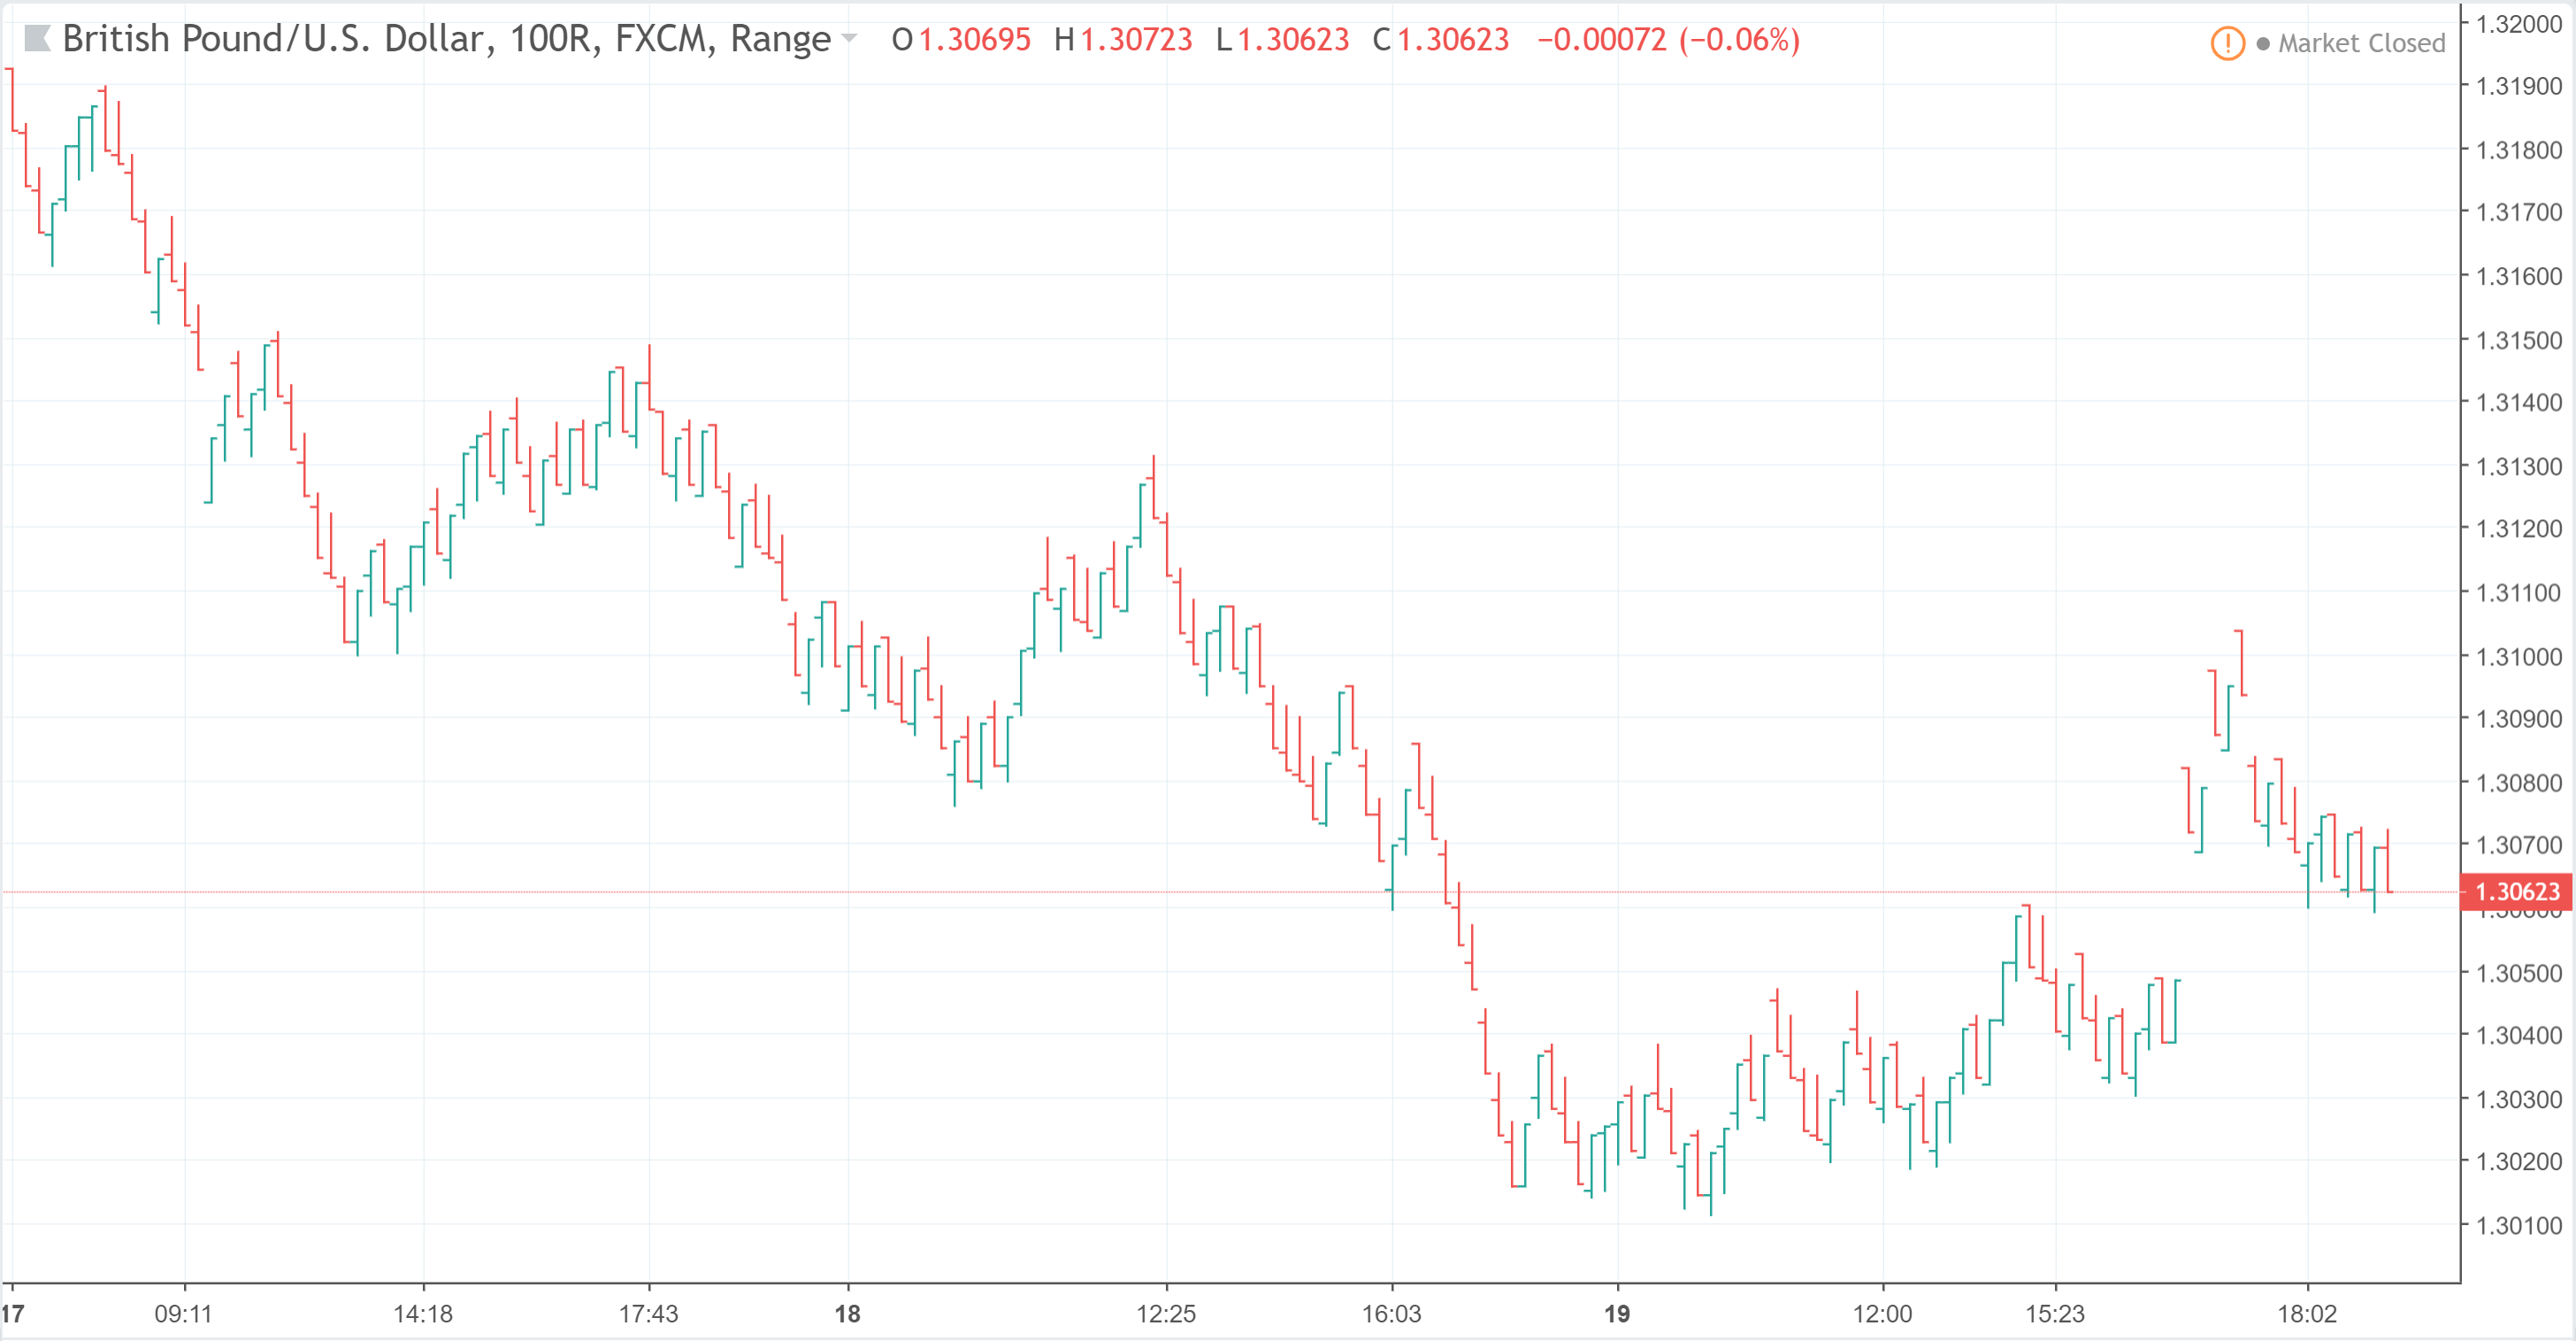
This particular example uses a range interval of 100. Generally speaking, the range interval sets the range in which the price moves, which in turn initiates the formation of a new bar. 1 range equates to one minimum price change.
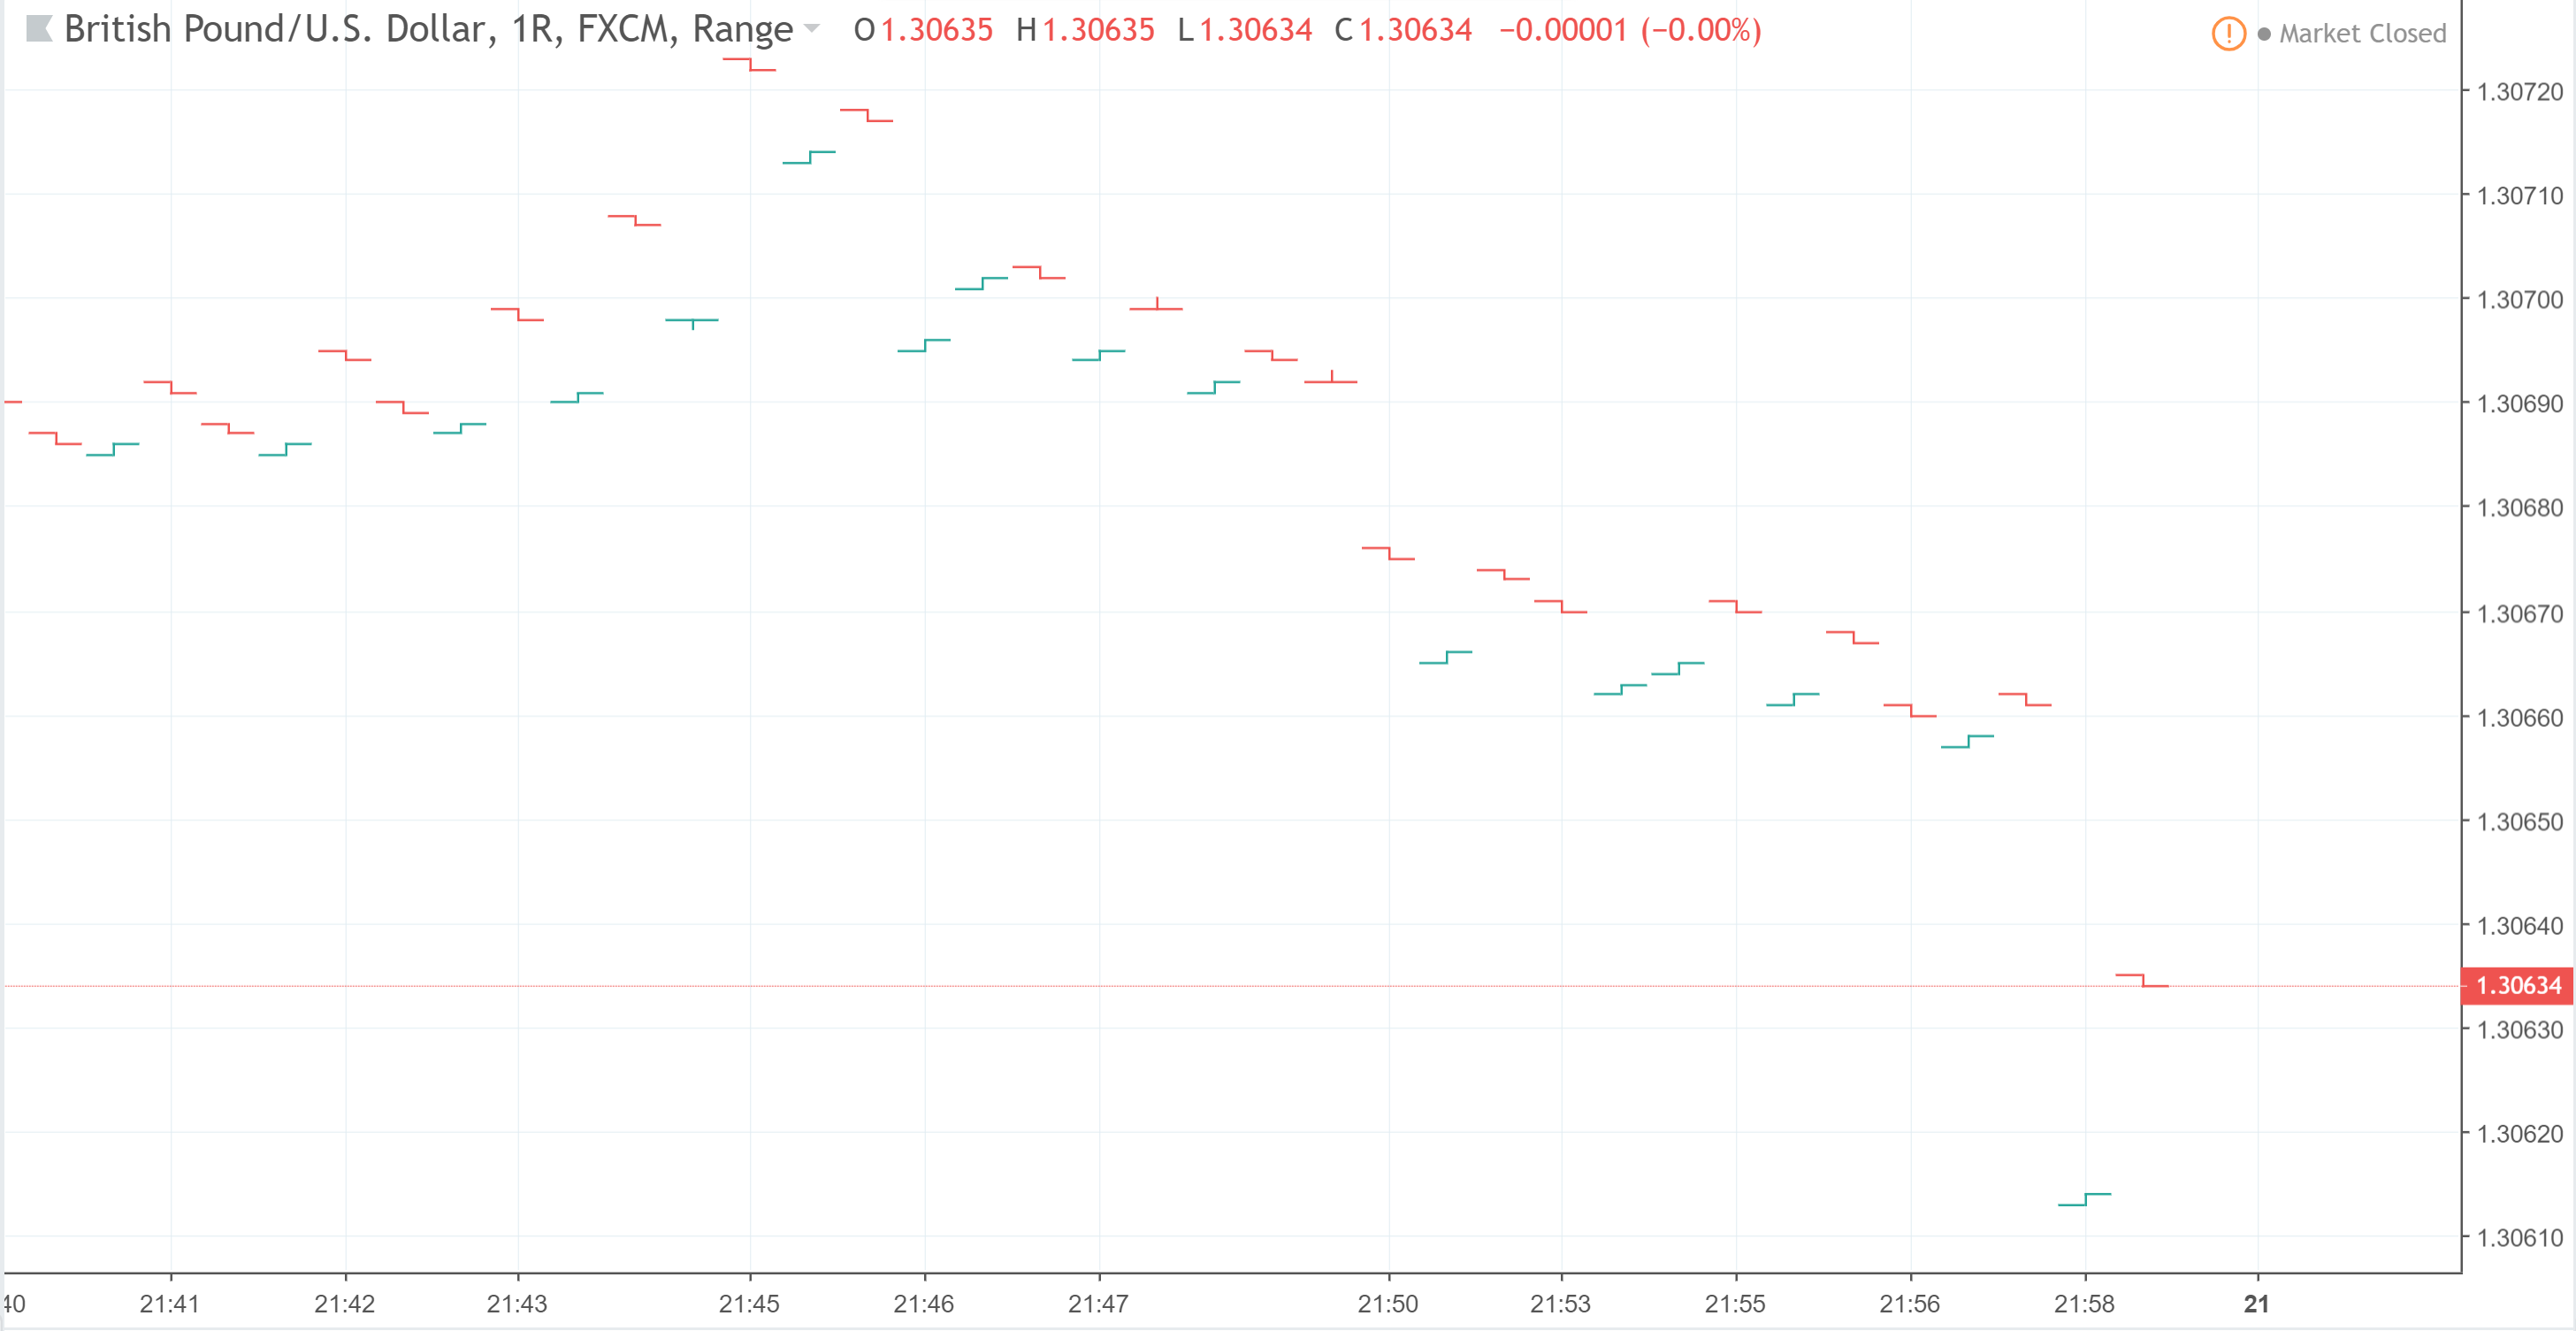
If the range interval was set to 1, the following chart is produced:
Advantages Of Range Bars
The first benefit of range bars is that they smooth out the price action and eliminate a lot of the market noise. Forex traders understand that the key to successful trading is to eliminate all this background noise. As range bars don’t rely on time, only price, periods of chopping action are minimised and false signals are reduced.
Another advantage of using range bars for forex trading is that they clearly highlight potential areas of support and resistance. Support and resistance areas that may have previously been hidden become clearly visible by using small range bars.
These areas can act as extra evidence for trades and also as highly effective potential exit points in trade management strategies.
However, arguably the most important advantage of all is that range bars can reduce, or sometimes even completely remove, the lag time of other indicators. By focusing on price alone and removing the time element, many indicators become much more accurate and powerful.
For example, moving averages can be used to help to enter trades based on market momentum. By removing time, trading can focus solely on the price movement, making the trade more accurate.
Reasons To Use Range Bars
In forex, there are a lot of external factors that can have an effect on the way trade signals are formed, creating doubt and confusion. In the forex space, this leads to hesitation that ends up with a missed opportunity.
Range bars show a trader the complete picture of what the price is doing. It does not matter what indicators you use, they will respond much faster and give a clear pattern to improve your trading.
Here are some other reasons why you should be using range bars:
1. The Trading With Range Bars Edge
Range bars have an edge over other indicators because the information they show is directly relevant to the trade. Time-based signals, on the other hand, are late by definition – the price footprint must occur first.
Range bars are valued by technicians because, unlike chronology-based signals, range bars show the actual price of a currency, established over an undefined amount of time.
2. Easy 8 Pip trades
If you trade the forex market and you seek to make 8 pips on a trade, wouldn’t it be more useful to pull up an 8 Pip candlestick chart? Yes it would be. An 8 pip candlestick would ignore time and instead concentrate on price movement alone, and the price is what ultimately matters.
Once the currency trade moves outside the 8 Pip range, another candlestick will form, no matter how many minutes or seconds this may take.
For the trader accustomed to viewing time-based candlesticks, not to worry. The visual look of the range bar chart is the same as a time-based candlestick, but you may find a clarity you never thought possible.
Trading Strategies Using Range Bars
There are a number of trading strategies that are unique to Range bars.
However, the simplest of them all is based on price action methods such as support and resistance and trend lines. Take a look at this graph from Orbex:

When trading with Range bars, it is important to choose the right pip value. Traders should take into account the spread of the instrument. Setting too small a range bar level could result in losses.
The chart above shows a simple support/resistance example using the range bars. As you can see, price action is quite straightforward when trading with range bars, bringing simplicity to the trading methods.
While there is no straightforward way to find the right pip value for the range bar based on the instrument you are trading, you can of course experiment. Most of the forex majors can have a range bar value of 15 – 20 pips and higher. This allows traders to build intraday trading strategies that also take into account the spread of the instrument as well.
Narrow Range Bar Trading Strategy
The narrow range bar (NR) strategy offers fixed stops and target levels. It can be used across any chart interval and the strategy in itself is built on solid principles.
The concept of this strategy is based on price action and states that when the range (High – Low) is the lowest or the narrowest within the past ‘x‘ number of bars, it is indicative of a big move (either to the upside or downside).
However, the NR bar strategy has many variations. One of the most popular methods is to take long positions when an NR Bar set up is formed above the 100, 200 or 250 simple moving average and short positions are preferred when an NR Bar set up is formed below any of those longer-term moving averages.
Also accompanying the NR Bar set up is the ATR (Average True Range) whose value is used to determine the stops and target levels. The entry price for NR Bar is often the high or low which varies by an offset of a few pips.
Scalping
Scalping can be used in any market but it is best (and has the lowest risk) when the market is range bound. This particular strategy does not produce the biggest profits, but, when the system is correctly applied, you can make money consistently.
You need two conditions to enter the trade.
Firstly, the price has to be at an extremity marked as one of the outer Bollinger band lines. You can tell if the currency is overbought/oversold when the range bar touches one of the outer bands.
When the currency is at the lower band, you should buy. Likewise, when the currency is at the higher band, you should sell.
Secondly, the current range bar must start retracing back towards the band after reaching its high or low point. This indicates that a brief pullback is taking place after reaching a short-term overbought/oversold state.
The price must retrace up towards the centre Bollinger band for a buy signal. The price must retrace down for a sell signal.
If both of these conditions are met, go ahead and enter the trade.
Success from this scalping strategy lies in precisely timing the entry and exit points. Refinement of these factors can make this a steady profit generator. Choice of suitable liquid currency pairs with low spreads and low slippage is also key to success.
Renko Bars
Similar to range bars, Renko (which means brick in Japanese) bars are fully dependent on price and are made according to a pre-decided range or size.
To help with the explanation, assume 3 pips are chosen for the EUR/USD pair. Then, for every 3-pip move in price in a day, a new Renko brick is formed, without any consideration about the time. So, if EUR/USD moves only 1 or 2 pips in a day, a Renko bar will not be formed.
This approach helps in showing price trends very clearly.
Here is an example of what a Renko bar chart looks like:
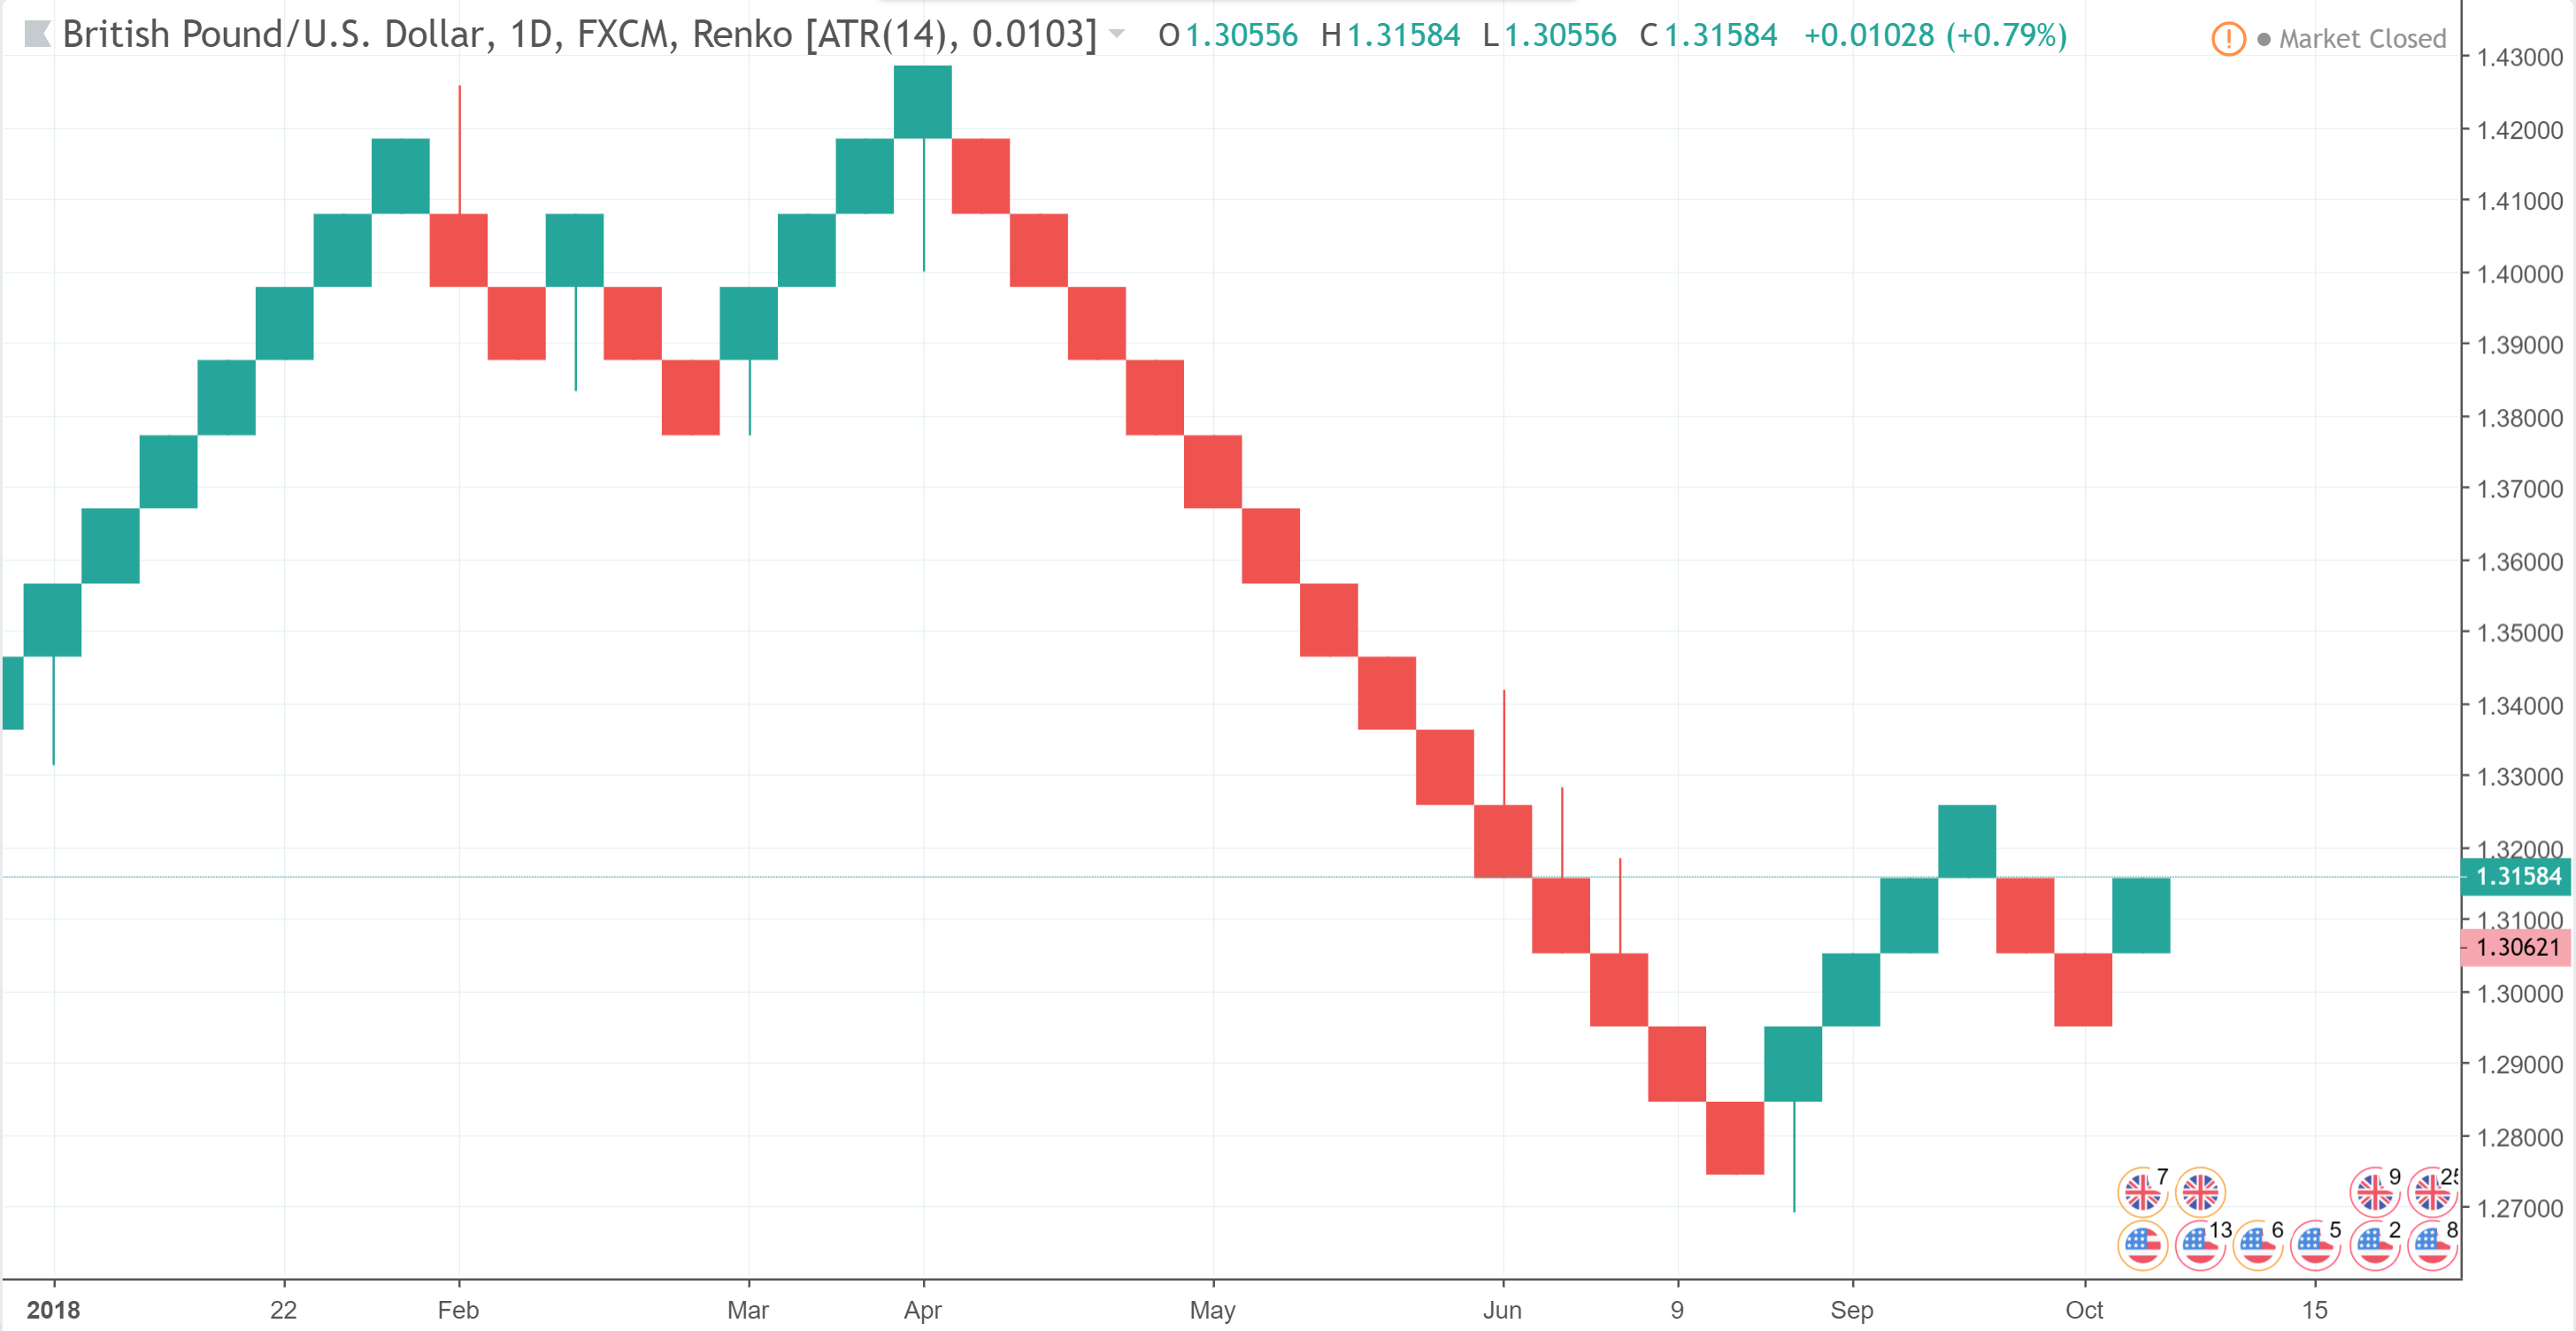
Renko charts are created by a simple three-step process:
First, choose your brick size. This is just the minimum price change required for a new brick to form on the chart.
Next, compare the current day’s close with the high and low of the previous brick.
If the closing price is higher or lower than the top of the previous brick by at least the size of one brick, one or more bricks are drawn in the next column in the respective direction.
Just by looking at the chart above, it is a lot easier to identify trends on these charts compared to traditional candlestick charts. Further noise reduction can be obtained by increasing the size of the bricks; however, this will also increase the intra-trend volatility – make sure that you have enough capital to withstand this volatility.
Range Bars Vs Renko Bars
It makes sense to now compare the two in further detail:
- All range bars and Renko bars are the same lengths, including reversals, but, the price must travel two times the Renko bar in the opposite direction.
- Both range bars and Renko bars help identify ranging price action but Renko bars may sometimes display flat or opposite bars if the ranging price action continues.
- Range bars and Renko bars can be used in any market.
- Similar to range bars, where the high and low levels are important, the closing prices are very important for studying Renko bars.
While range and Renko bars reflect price action more clearly, there is a big disadvantage to be aware of.
Price movements reflected by a bar appear to be perfect but, in reality, this may not be true. The price may have moved up and down a lot before the bar was actually drawn on the chart.
This is obviously not ideal for traders that rely on these bars in small settings. They will often lose out on trade opportunities because they can’t enter when the brick is drawn and may also lose on account of the spread.
Conclusion
By now, you’ll know that range bars don’t use the time to measure price. Instead, they rely on volatility.
You’ll also know that range bars can reduce, or sometimes even completely remove, the lag time of other indicators.
If you haven’t already done so, check out our free ebook or if you’re looking for an advanced course to increase your income, we have that covered too.

Tom is the owner of Elite Forex Trading. A website that provides beginner tips, trainings, reviews and strategies to help newbies get started making money in the forex markets.