Forex swing trading is a longer term method where a trader invests in a financial instrument and holds on to it for period of days or weeks at a time before selling for a gain. Investors looking at forex swing trading will be monitoring short term patterns in the markets and identifying opportunities that are displaying significant changes in momentum.
The main aim of swing trading to take advantage of a sudden change of price in an instrument than what is usually expected on a day to day basis. Swing trading relies on the knowledge of technical analysis to identify these trends.
This is different to day trading as you will be holding the instrument when the markets close overnight at the minium. This means that the instrument is liable to going through potential significant changes in its price without any movement being tracked. It’s starting price may be considerably different to the prior evening’s closing price.
I would not recommend swing trading if you are new to forex trading. If you would like learn from scratch or you have some knowledge but want to improve understanding of strategies, I have another post specifically for trading forex strategies for beginners.
Differences between swing trading and day trading
The main difference between swing trading and day trading is time. As stated in the name, day trading takes place over a single day. Day trades can be concluded in a matter of hours or even minutes, whereas swing trading occurs over a longer period such as a couple of day s or even weeks.
As a day trader, you won’t be holding onto a trade when the markets close. An advantage to this is that you won’t be affected by an sudden changes of rates that could appear overnight. Swing traders on the other hand are affected by this as exchange rates have the potential to fluctuate overnight, and sometimes dramatically change, so it’s an important factor to make a note of when entering a trade.
However, there is a downside to trading over a short period of time. Sometimes the gains you make won’t be that large, and due to trading markets charging commission and other costs to use their service, profits can sometimes be negligible. Swing traders are also affected by the same costs but they take less of an effect as they operate over a longer period of time.
Investor’s Business Daily shows that in order to combat this, day traders have the option to leverage their portfolios with more margin, four times the buying power rather than double.
Taking larger leveraged positions can increase gains to offset against incurred costs. But with more leverage comes the potential for bigger losses. Factors such as misjudgement in a trend or even if you get unlucky, can have a damaging impact on your forex portfolio. With swing trading, leverage is lower meaning that if something goes horribly wrong, it’s less likely to take a huge effect on your investment.
The amount of time that is spent on a trade is another big difference between day trading and swing trading. Day trading requires being on the constant for emerging patterns in the markets and being able to enter a trade as soon as they occur. The is means that all of your time is spent on looking for trades and leaving no time for anything else from when the markets open until they close.
A day trader is more likely to have this as their only source of income due to the time constraints. Relying on successful trades put a lot of pressure on a day trader so getting them right and often is vital.
This is different to swing trading in that a lot fewer trades are made. As the trades are taken over a longer period of time, they can be checked on less often when a day trader where it’s crucial to keep an eye over developments at all time.
The final main difference between day trading strategies and swing trading is the levels of knowledge required.
Since day traders will be relying on gains as their source of income, they will require a high technical understanding of trading. Swing traders however do not require as in depth knowledge of the markets. Swing trades can be entered by anybody who is looking for some extra revenue and fancies a stab at the markets.
Before swing trading, pay attention to…
Bankroll management
The aim of swing trading is not to make a quick buck overnight. Due to the long term nature of trading, the best way of profiting from swing trading is by taking lots of smaller gains rather than waiting for the difference in forex rates to get as large as possible and taking a larger but a much riskier gain. What’s great about swing trading is that you don’t require a large bankroll to do it.
Of course, there won’t be profits on every single trade you make so limiting your losses is important. As a swing trader, you should be looking at a profit to loss ratio of around 3:1. Being able to cap your losses is invaluable as even one huge loss on a trade can wipe out a series of small gains.
So with forex swing trading, the aim is to only use between 1 and 2% of your bankroll. The more money that is lost on forex trades means that it becomes even more difficult to regain those losses and get back to the your original bankroll again.

Image taken from Broker Reviews
As we can see from the above table, if you end up losing 20 trades in row by implementing a 1 or 2% per trade strategy, the maximum you can lose on trades is 33% of your bankroll. Compare that to even a 5% per trade strategy and the percentage of your entire capital lost doubles!
So make sure that you stick to a 1 or 2% investment per trade.
Table of Contents
Selecting your currency pairings
There are so many currency pairings to choose from. The number one thing to do when selecting a currency to trade on is to do research.
Take some time out of your day and find the latest news that covers how that particular market has been faring recently and if any upcoming factors are going to apply.
 For example, if we look at the price of GBP against EUR, one of the biggest factors that has affected the exchange rates over the last few years has been Brexit.
On 22 June 2016, the closing rate was 1 GBP to 1.31 EUR. On 23 June 2016, the British public voted to leave the European Union and this saw a huge a huge drop in value of GBP.
By 27 June 2016, it had dropped to 1 GBP to 1.20 EUR.
If any forex swing traders predicted this result they would have made a healthy profit so paying attention to current affairs can help you make significant gains.
So make sure you are fully updated with the latest financial news, emerging stories or expected announcements that are due to be made in the coming days or weeks that could affect the exchange rates of any major currency.
I suggest that you wait at least 15 minutes after a news release before entering a trade. This allows time for the larger players in the market to absorb the news but still leave you enough time to profit on the big changes while the news is still relatively fresh. The prices are usually very volatile after some big economic news has developed so implementing a wider stop out point will mean you are less likely to lose your investment.
Methods of swing trading
Bullish swing trading
Forex prices seldom are linear in movement. If you take a look at the live prices, it is almost certain they will have both increased and decreased over various times in the day. By analysing the prices of a longer length of time, a pattern will emerge that will show the general direction in which the forex prices are heading. If the pattern is generally showing an increase in exchange rates over the period, the market is experiencing an uptrend.
Bullish swing trading relies on identifying the start of an uptrend and monitoring it until it enters the counter-trend stage ie it starts to temporarily decrease in value, before resuming the uptrend.
A graph taken from ASX helps show what a bullish trade looks like in practice.
As a bullish swing trader, you should only look to entering a trade once the original uptrend has continued. Once this has been determined, it is time to enter the trade. The spot of which you entered the trade is known as the entry point.
The next part of the process requires you to identify the lowest point of the counter-trend to determine the stop out point. Throughout the trade, if the exchange rate ever falls below this point, I recommend that you exit the trade. As the stop out point will be below your entry point, you can limit the loss on the trade by minimising any further risk of the exchange rate decreasing further.
Next, analyse the uptrend and find the highest point. If any forex gains reach this point or start to exceed it, I recommend that you should exit the trade with a small portion of your investment in order secure a profit. By doing this, you guarantee that you have made some money from the trade but also potentially score further gains if your remaining investment continues to yield good returns.
Bearish swing trading
Where there are increases in exchange rates, there are decreases. In 2008, you could get nearly 2USD for 1GBP. Nowadays, 1 GBP translates to around 1.4USD.
By being able to find a downtrend in the forex markets, where the general direction of the value of one currency is decreasing compared to its pair, a bearish swing trader can invest.
ASX also has a simple example of a bearish downtrend.
The downtrend will also experience brief counter-trends in which the exchange rates increase temporarily but when this counter-trend ends, the downtrend continues. Once the original decreasing pattern continues, this is where you as a bearish swing trader should enter a trade.
Similarly as in the bullish swing trade process, identify the stop out point to minimise losses. The stop out point on a bearish trade will be the highest point of the counter-trend. If the exchange rates actually increase past this point, I would recommend exiting the trade.
Analyse the downtrend and identify the lowest point. If any forex gains reach this point or start to exceed below itt, I recommend that you should exit the trade.
Counter-trend trading
Most swing traders will be looking at the main currency trends. I the exchange rates are experiencing an uptrend, they will be trading based on their increasing nature. Some other traders however will be looking to trade against the main trend. This is known as counter-trend trading, also referred to as fading.
If forex rates are experiencing an uptrend, counter-trend trading predicts that the forex differences will decrease and so will take a bearish approach at the highest swing in order to maximise gains.
The Hull Moving Average strategy
This is a method developed by Alan Hull and is a very fast moving average indicator. The benefit of this means that the lag time is completely removed and that it enables you to quickly trace signals indicating any upcoming changes in market trends.
The Hull moving average prepares you as a swing trader to get ready to either buy or sell your forex by noting the change of direction the ‘slope’ of the average price.
A longer period Hull moving average may be used to identify trend. If the Hull moving average is increasing, the resulting trend is rising, indicating it may be better to enter trades with a buying position. If the HMA is decreasing, the resulting trend is also falling, indicating it may be better to enter a trade with a selling position.
A shorter period Hull moving average may be used for entry signals in the direction of the prevailing trend. A buy entry signal, when the resulting trend is rising, occurs when the Hull moving average turns up. A short entry signal, when the resulting trend is falling, occurs when the Hull moving average turns down.
The Hull moving average is determined by the following calculation:
HMA = WMA (2 * WMA(n/2) – WMA(n)),sqrt(n))
Where
WMA = weighted moving average
n = period of time configured based on trading requirements.
Compared to other moving average methods, such as the simple moving average or the exponential moving average, the Hull moving average is a lot more dynamic when it comes to analysing movements in prices while maintaining a smooth curve.
CCI moving average
This strategy relies on moving averages to show you the market trends. It uses the commodity channel index (CCI) indicator to show you if the market has been overbought or oversold.
When selling forex by this method, identify the downtrend in the exchange rates and wait for the counter-trend to get back to the moving currency averages. At this point you should check the CCI to see if it crosses or is above the 100 line.
If this is the case, confirm that the downtrend is bearish and enter the trade below the low of the bearish candlestick. The stop out point should be above the high of the bearish counter-trend candlestick. Set your profit point to the previous swing low.
An example of this is shown below:

Image taken from forextradingstrategies4u
When swing trading for buying forex by the CCI moving average method, identify the uptrend in the exchange rates and wait for the counter-trend to get back to the moving currency averages. At this point you should check the CCI to see if it crosses or is above the 100 line.
If this is the case, confirm that the uptrend is bullish and enter the trade above the high of the bullish candlestick. The stop out point should be below the low of the bullish counter-trend candlestick. Set your profit point to the previous swing high.
An example of buying forex from CCI moving average swing trading is as follows:

Image taken from forextradingstrategies4u
Bollinger Band strategies
The Bollinger Band, developed by John Bollinger. He defines them as curves drawn in and around the price structure usually consisting of a moving average, ie the middle band, an upper band and a lower band. The purpose in relation to forex is to find out if the currency prices are high or low on a relative basis.
If the exchange rates are rising above the moving average line, the currency is in an uptrend. Similarly, if the exchange rates are falling below the moving average line, the currency is in a downtrend.
This forex swing trading strategy uses the dynamic support and resistance concept.
Dynamic support means that at some point, the price of the currency will fall and hit the lower band and then rise.
Dynamic resistance is the opposite; at some point the price of the currency will increase and hit the upper band and then decrease back down.
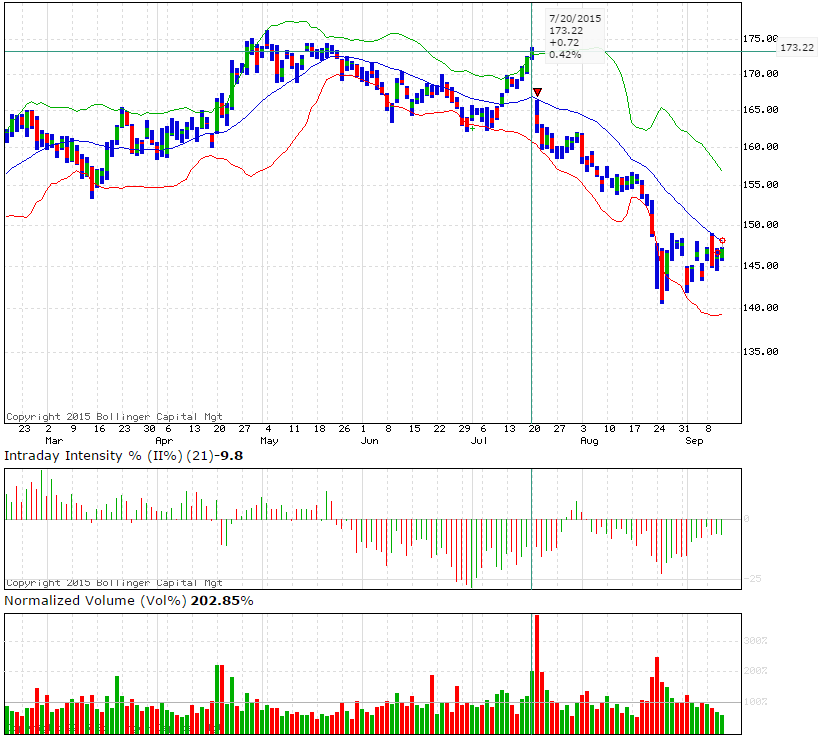
The green line represents the upper Bollinger band, the blue line is the moving average of the price and the red line is the lower Bollinger band.
When selling forex, wait for the price to reach the upper Bollinger band line. Once this happens, enter the trade.
When buying forex, wait for the price to dip to the lower Bollinger band line. Enter the trade once the candlestick hits the line.
Bollinger Bands can be used for a number of different strategies. A common example uses a double bottom setup.
The initial bottom of this formation tends to have substantial volume and a sharp price counter-trend that actually closes outside of the lower Bollinger Band. These types of moves typically lead to what is called an automatic rally ie when the forex prices are driven too far due to excessive selling, creating a vacuum. As soon as the downtrend has stopped, the price begins to reverse and increases automatically, known as an automatic rally.
After the automatic rally has started, the forex prices will try tretest the most recent lows that have been set to challenge the large amount of currency buying that occured at the double bottom.
By retesting, it demonstrates there has been a shift in selling the currency to buying.
Bollinger bands are also used to predict an upcoming squeeze in the currency prices. This occurs when there is a lack of both supply and demand which results in a sudden rally in prices.
The Bollinger band squeeze method is built on the premise that when the width of the Bollinger band reaches its lowest level in 6 months, it becomes a lot more likely the the price of the currency become more volatile and subject to sudden changes. The squeezing action of the Bollinger band means that a large move in the prices is imminent.
The Gartley pattern
This is a complex swing trading method. The Gartley pattern is based around using Fibonacci geometric sequences to identify and predict future changes in the currency prices such as counter-trends.
Developed by HM Gartley in 1935, it represents bullish or bearish patterns in forex prices by using M/W shapes in the market movements.
The benefit of using this swing trading method is that they don’t just focus on how big the movements in prices are or their timing. It actually focuses on both!
An example of a Gartley pattern looks like the following:
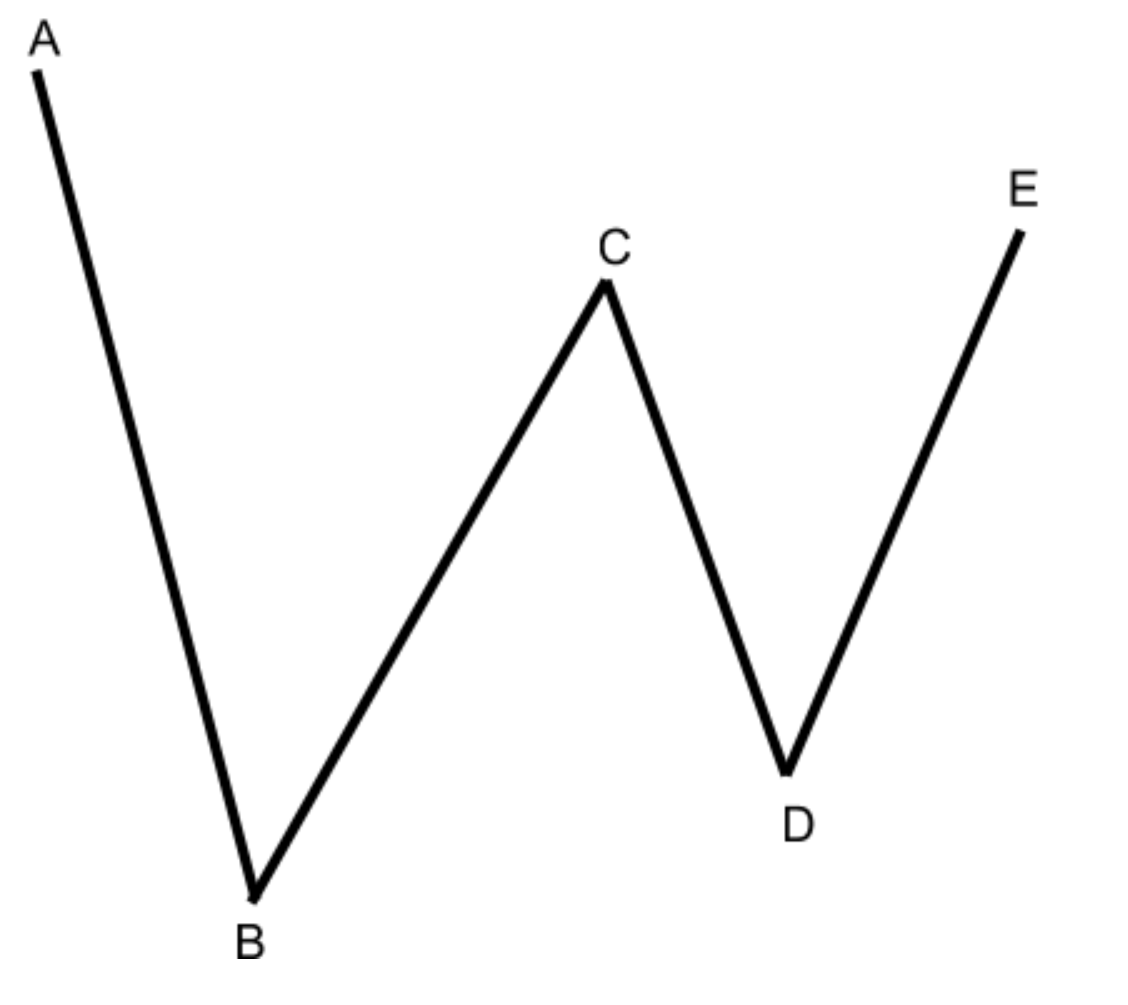
The Gartley pattern starts at point A and composed of four swings in price movement. The patterns is concluded at point E.
Each swing is specific to a particular Fibonacci level. Using the above example, we will go over each swing of the Gartley structure.
AB: Swing AB does not relate to a specific in the forex price movement; this could be due to any factor.
BC: Swing BC should now be around 61.8% of the size of AB. So, if AB is a bearish price movement, the BC price movement should be bullish and hit the 61.8% Fibonacci counter-trend of AB.
CD: Swing CD should now show another bearish movement at the end of BC’s counter-trend. The price movement should either be at 38.2% of the Fibonacci level or should be 88.6% of the Fibonacci level of the BC swing.
DE: Swing DE should now show a counter-trend of the CD movement. If the movement was 38.2% of the BC swing, DE should represent a 127.2% growth of CD. However, if CD showed a 88.6% of BC, then DE should be a 161.8% growth of CD.
EB: This is the final rule to confirm there is a Gartley pattern in the forex price movements. When swing DE has concluded, swing EB should take a 78.6% counter trend of the AB initial movement.
Using the above rules, the original Gartley diagram should look like the following:
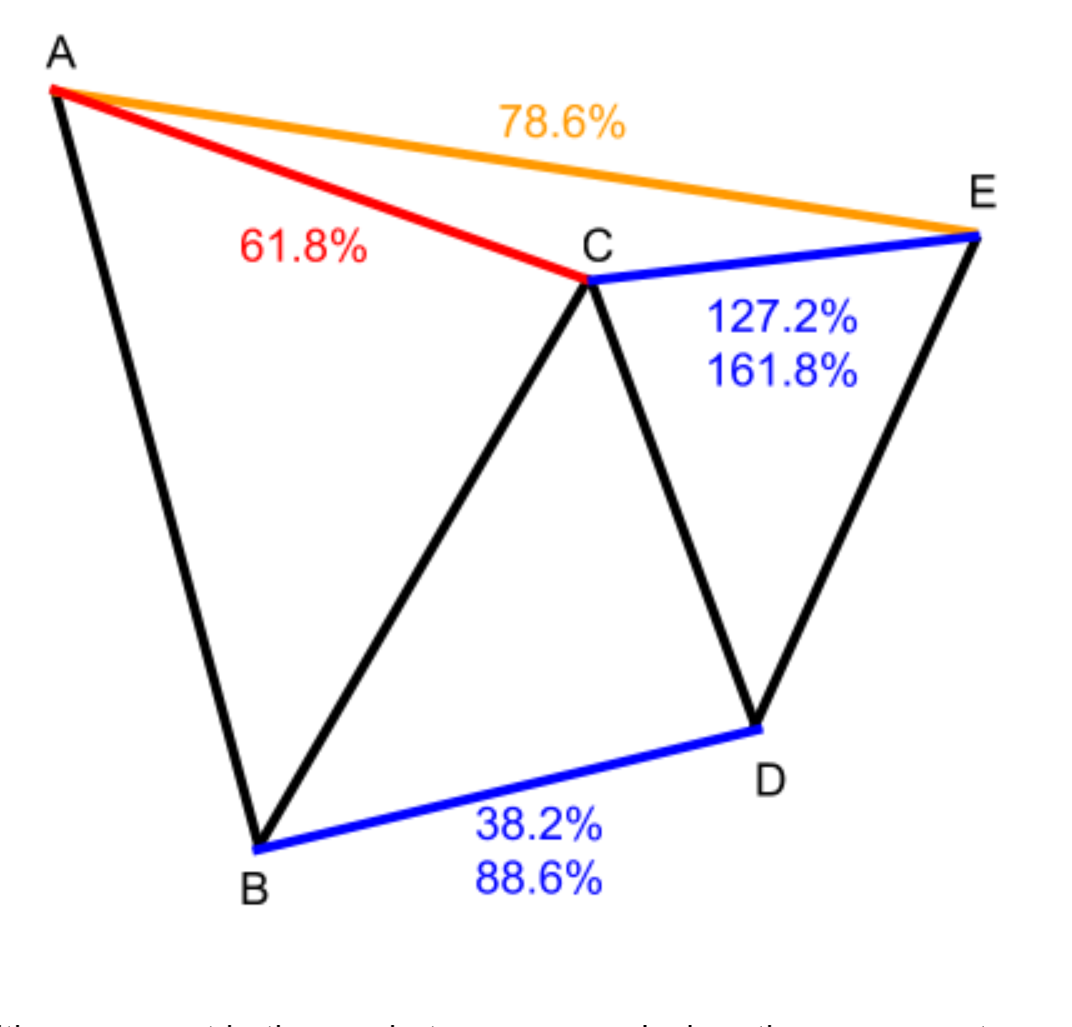
If all five conditions are met in the market you are analysing, the movements are a Gartley pattern.
We would then expect to see a bearish movement once swing DE has concluded. The expected price point is a 161.8% growth of BE. The pattern will look as follows:
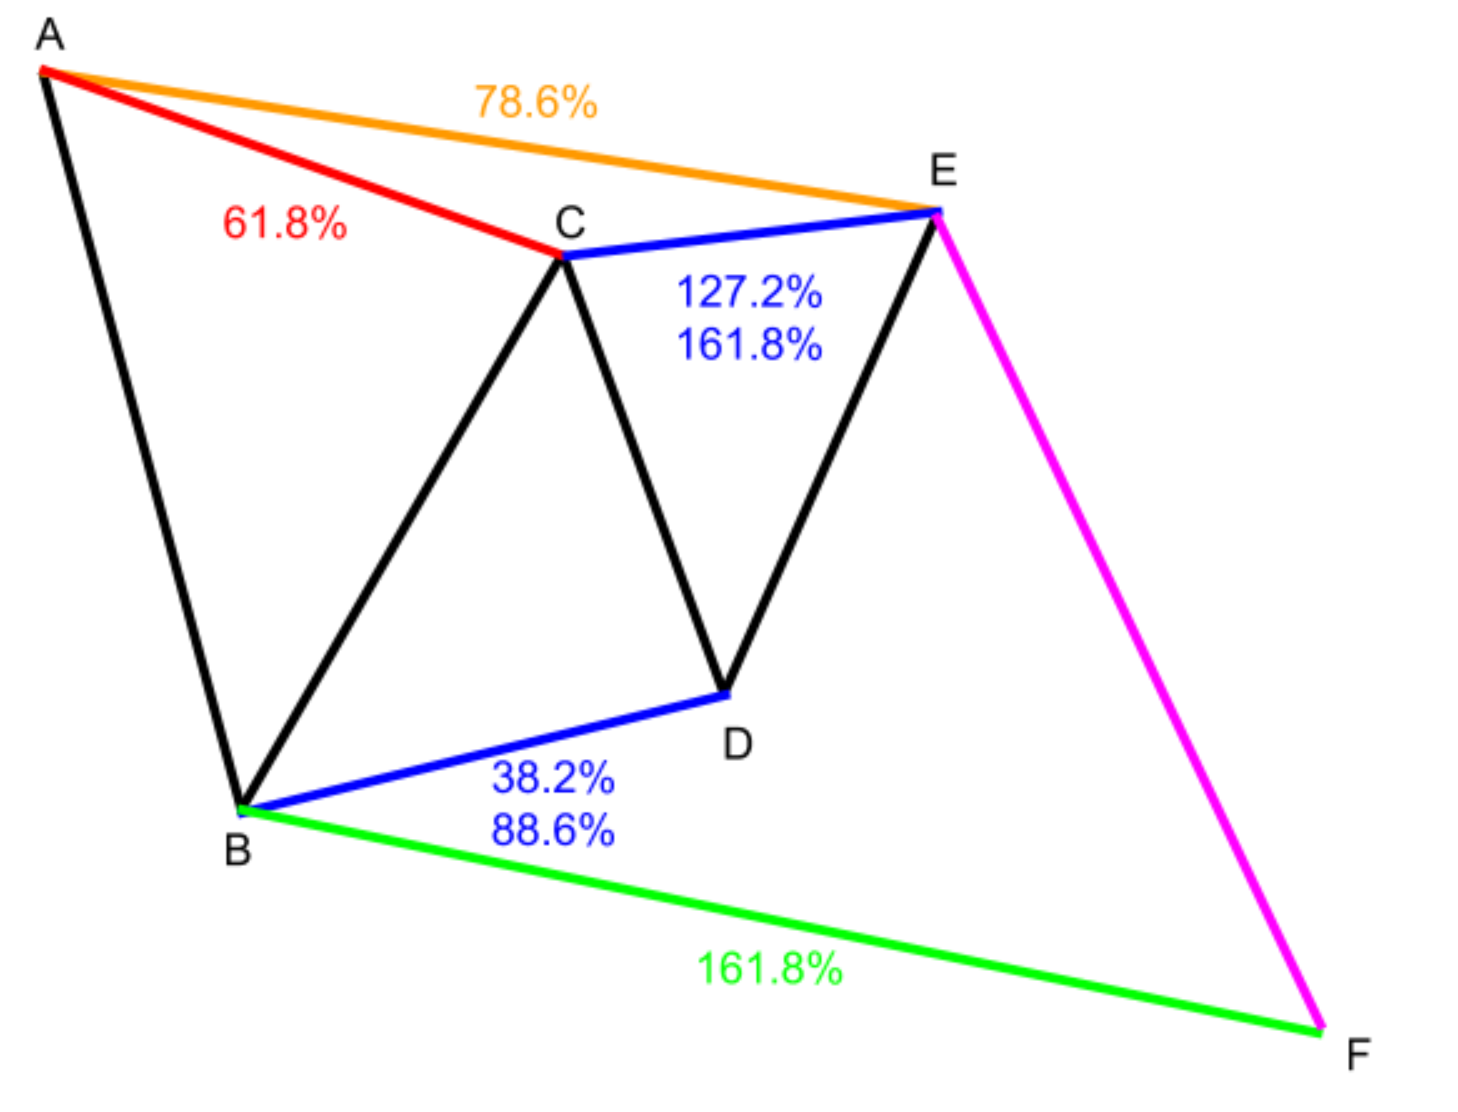
The pink line represents the expected direction of the bearish Gartley pattern. It is expected to be 161.8% of the Fibonacci growth of swing BE.
You would enter the trade at swing point B, with your stop out point being the original point A to minimise potential losses. The profit point in this bearish Gartley pattern swing trade is point F. Once the forex prices have reached this point you should be looking to exit the trade.
Before this however, there are two other profit points you should be looking to make: point point D and point B.
Since you can expect to see the forex price to fall to point F, they must drop below all these points so by putting profit points at these swing points along the way, you can guarantee some gains.
All these rules also apply to a bullish swing trade. The pattern you will be expecting to see will look like this:

So, when starting a Gartley pattern forex swing trade, look out for the M/W trend in the markets and then confirm the Fibonacci levels are as expected before entering the trade.
Relative strength index
This is not a strategy per say but more of a tool that can help you with forex swing trading.
The relative strength index (RDI) indicator is used to detect temporary excessive buying or selling in the forex market.
When implementing the RSI into swing trading, it’s important to monitor the readings and compare them to other momentum or trend indicators to confirm that a change in trend is about to happen.
Using the ADX indicator
The average directional index (ADX) indicator is used to decide when the price of forex is trending strongly. Similarly to Bollinger bands, it requires using the moving average over a period of time.
The ADX is a single line with values ranging from 0 to 100. It bases the strength of trends using the positive and negative directional movement indicator (DMI) lines.
If the positive DMI line is above the negative DMI line, the ADX determines the strength of the uptrend. Likewise, if the negative DMI line is above the positive DMI line, the ADX determines the strength of the downtrend.
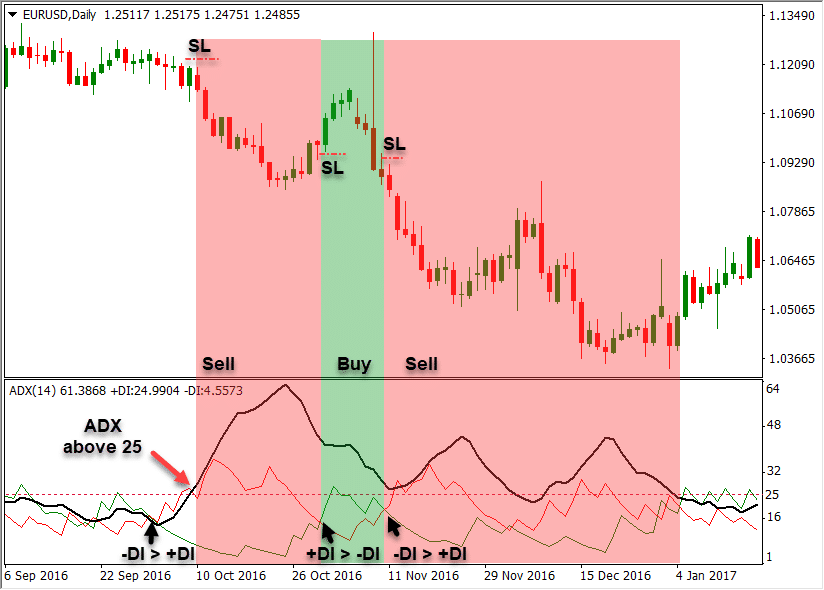
Image taken from Market Traders Institute
The black line in the diagram above is the ADX indicator. The green line represents the positive DMI and the red line represents the negative DMI.
The ADX values help swing traders analyse how strong the trends are. A value under 25 represents a weak trend, between 25 and 50 represents a strong trend and anything over that is a very strong trend.
When buying or selling forex, you need to identify strong trends before entering a trade so only enter trades when the ADX value is 25 or more.
A popular swing trading method using the ADX indicator is based on the crossing over of the positive DMI line and the negative DMI line. This method was developed by Welles Wilder, the inventor of ADX indicator itself.
When the positive DMI line crosses above the negative DMI line, there is an uptrend in the market. Likewise when the negative DMI line crosses above the positive DMI line, there is a downtrend.
Going back to the diagram above, at first crossing of the DMI lines, the negative is above the positive, indicating a downtrend. However, the ADX indicator did not go over 25 and therefore it is not strong trend, so you should not be selling on the downtrend.
However, if we look at the second crossing of the DMI lines, the positive is above the negative, indicating an uptrend. On this occasion, the ADX indicator is above the necessary 25 threshold and so the trend is strong. On this basis, you can be confident that buying the currency is the correct trade.
Trendline swing trading
This method of forex swing trading is designed to trade when the markets follow the trend line. In order to do this, the trend line itself needs to be designed.
In order to draw the trendline, you will need to identify at least two high and low swing points in the time period you are trading in.
Once the lines have been drawn, you need to wait until the prices reach your trendline at either the third, fourth, etc swing point. After this happens, it’s time to buy or sell.
If at some point the trend of the market breaks the trend line, the prices will have weakened and so a change in trend could be happen soon.
Here is an example of how an uptrend trendline is drawn in practice: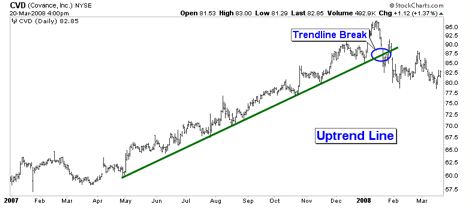
Image taken from stockcharts
And here is an example of a downtrend trendline:

Image taken from stockcharts
The advantages of using this strategy for forex swing trading is that if the trend is strong, you can buy or sell at the very top or bottom of the price swings but also able to keep stop out points as tight as possible. The strong trends mean the chances of the stop out points being breached earlier than expected.
However, there will be times where you can draw a trendline using the first and second price swings but the prices may not ever reach the necessary swing point in order to enter the trade. Of course, if they come very close then it you could trade on the trendline basis but it won’t be an as accurate method. Plus, it will also come with added risk as you don’t have the certainty that the trend is following the expected line.
Like what you have read? Head over to our homepage for more tips and strategies on forex trading.

Tom is the owner of Elite Forex Trading. A website that provides beginner tips, trainings, reviews and strategies to help newbies get started making money in the forex markets.