There are plenty of indicators available to current forex traders. Every couple of months or so, an investor will claim to have found a new method.
What happens in reality is they have regurgitated an existing treading strategy.
Nothing new here then,
However, there is one indicator that has proven to be effective since its birth. Year in, year out, Bollinger Bands are used as part of modern day forex trading methods.
Table of Contents
Who came up with Bollinger Bands?
As the name suggests, a very smart trader named John Bollinger.
He created the indicator back in the 1980s after noticing that volatility was dynamic, not static.
Introduction to Bollinger Bands
Bollinger Bands are charts that aim to characterise forex prices and their volatility over a set period of time. These charts are used as a tool to make decisions on what trades should be made or as a component of technical analysis.
Take a look at this example from Investopedia
Bollinger Bands display three distinct graphical bands, namely:
- the upper band;
- the lower band;
- the N-period moving average (MA);
The upper Bollinger Band is K times an N-period standard deviation above the N-period moving average.
The lower Bollinger Band is K times an N-period standard deviation below the N-period moving average.
Note: N and K usually take values between 2 and 20.
The standard average band used is typically the simple moving average (SMA) but it is not uncommon for the exponential moving average (EMA) to be used. The same period is used for both the MA band and calculating the standard deviation.
Bollinger Bands indicate the relative high and low forex prices.
Prices are high near the upper band and low near the lower band.
The more that the price actions fluctuate, the distance between the bands expand. Likewise, they contract when price actions consolidate.
If you want to do a bit of background reading, I suggest looking at Bollinger Bands’ own website, in particular this page on all the rules that surround Bollinger Bands. It’s all very technical but this post is dedicated to their uses rather than a full definition.
I have linked to the page here if you want it.
How to use Bollinger Bands
As you have probably realised, Bollinger Bands can be used to measure volatility in the markets. But that’s not all they are useful for.
Bollinger Bands are good for identifying areas of resistance and support in the markets. While you could use the middle band for this process, it’s netter to just use the upper and lower bands.
Bollinger Bands give off certain signals that indicate potential changes to price actions.
Here are some of the signals you need to be on the lookout for:
Price touching the upper band
We have briefly touched on this already. When prices approach the upper Bollinger Band, the forex prices are relatively high. When they get close to this band, it would not be unreasonable to think that a bearish swing is imminent.
From strictly trading point of view. a short trading opportunity has arisen.
But, if prices start to increase at the upper band rather than decrease as previously expected, and the distance between the upper and lower bands keeps getting wider, be careful placing a short trade.
If a strong uptrend continues above the upper band, the signs are still showing that trend continuing, resulting in a loss on the short trade.
Price touching the lower band
This is the exact same as the previous signal but in the opposite direction. The closer the prices fall to the lower band, the more likely a bullish swing is about to happen.
However, if the bands expand and the prices start to decrease below the lower band, the downtrend is likely to continue.
Check out this chart from FX Leaders to see this in action:
Signals from the MA band
The MA band provides a key confirmation signal after a price pairing interacts with the upper or lower price bands.
If the currency prices hit the lower band, rises and continues increasing to break through the 20-period SMA, there is a strong sign that there is opportunity to take a long position.
Similarly, if currency prices hit the upper band, falls and continues decreasing to break through the 20-period SMA, there is a strong sign that there is opportunity to take a short position.
This is known as the moving average breakout.
From this, it makes sense to use the 20-period SMA as an exit point when entering a trade using Bollinger Bands.
Contracting Bollinger Bands
The closer the bands are to each other, the less volatile the prices of the forex pairs are.
During this period, there are not many trades going on which results in a consolidating market. The Bollinger Bands contract close together.
Tighter the price ranges, the less you should be thinking of entering a trade. There are far less profitable opportunities. This also means that the direction prices for that currency pair will take becomes harder to predict.
After a period of squeezed Bollinger Bands, the markets will expand and become more volatile. Forex markets will usually work in this way.
See this chart from FX leaders as an example:
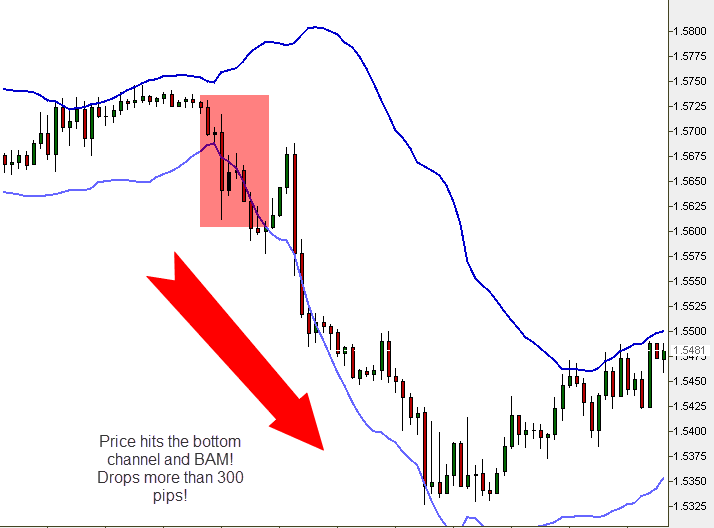
Notice before the red zone, the distance between the two bands are close together before the breakout. The prices were relatively stable until the end of the squeeze.
Trading with Bollinger Bands
If you have grasped an understanding of how Bollinger Bands are used for trading, it’s time to put them to use.
Here are some of the trading strategies that utilise Bollinger Bands.
Bollinger Bands with candlesticks
When the candlestick low touches the lower Bollinger Band, take a short position on the forex pair and exit the trade once the direction of the candlestick reverses.
If you choose to take on this method, a stop loss order should be placed beyond the reversal candlestick.
It may be a good idea to set up a separate profit point at the MA band to lock in at least a small profitable trade. At this point, take half of your profits out and leave the rest. Candlesticks do not tend to indicate huge price swings so at least this way, you won’t lose money.
As the prices continue to break through the MA band, you can capitalise.
The more the prices trend in the direction we have traded on, the MA breakout should be used an exit signal.
Alternatively, if there are signs that the trends are to reverse, don’t wait for the M breakout and just exit the trade as soon as possible.
Trading inside Bollinger Bands
This method is so standard it borders on boring. It is based around the cliche ‘buy when it’s low, sell when it’s high’.
However, boring as it may be, it’s power to bring in the money cannot be underestimated.
When you trade purely within the Bollinger Bands, all you’re doing is buying when the pairs are at their lowest value at the lower band and selling at their highest value at the upper band. It’s that simple.
The main component of this trade is setting yourself a clear range to trade in. The bands give you a guide to follow.
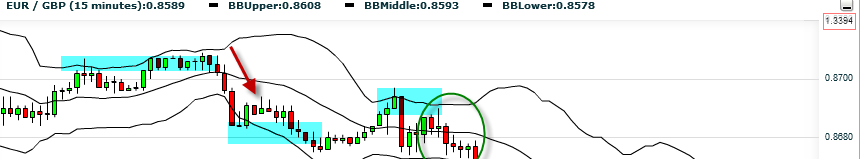
Let’s go back to one of out first images:
As you can see, by using this simple method, you would buy in the second blue zone and then sell in the third. Yes, it’s that easy.
By using Bollinger Bands as the limits, you can make a good judgement on how volatile the market is based on the how far apart the upper and lower bands are. The greater the distance, the more volatile the market and the more chances to make a decent profit.
This method is probably the safest Bollinger Band trading method. Just stay within the ranges and collect your gains on trend changes.
Double bottoms
This is another common Bollinger Band trading method that searches for pairs that have a specific setup.
The initial bottom of this formation tends to have substantial volume and a sharp price pullback that closes outside of the lower Bollinger Band.
This is commonly known as an ‘automatic rally’. The high point usually ends up being the first level of resistance before forex prices increase.
After the automatic rally starts, currency prices try to retest low prices. During the retest stage, if the prices stay above the lower band, the attitude has shifted from selling to buying. It’s important to keep an eye on the volume of trades; it must be have rapidly subsided.
Here is what it looks like in practice (Pinterest for the image):
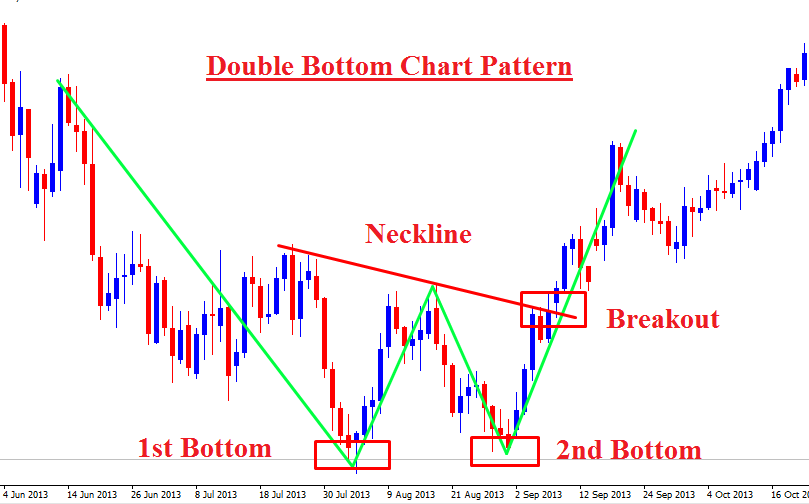
As I said, getting this precise setup relies on securing that second bottom to break through the bands to get a strong trade signal.
Riding the Bollinger Bands
This strategy is for those of you that do not mind trying something with a high risk, high reward sentiment.
We said earlier that when the forex prices approach the upper band, it is most likely they will turn bearish and fall.
Riding Bollinger Bands is a more aggressive trading strategy that will only get you a win percentage of around 30%. However, when it pays off, it pays well.
Especially after a breakout, if you give the prices enough time, it can be extremely profitable to let them loose. The more the prices break through the upper or lower bands, the greater profits you can expect.
You will be able to tell when the prices are likely to break through the bands based on the volume of the trades. The more the volume increases, the chances of prices exceeding the band boundaries increase.
As a counter measure to make sure you don’t lose money from this strategy:
You will notice that the strength of the trend will weaken if prices that were once breaking through the bands no longer do so.
It would be smart to exit your trades when you notice this pattern emerging.
Predict contracting Bollinger Bands
This strategy is similar to riding the Bollinger Bands in terms of profitability but instead of letting the trade go nuts, you take them quickly as trends go your way.
Earlier in this post, I talked about how Bollinger Bands contract when forex prices consolidate. Well, if you can predict when this squeeze is to occur, you can make profitable trades.
When Bollinger Bands reach their lowest point, forex prices will be in their most volatile state. This may seem obvious but it’s worth stating.
After prices have reached this point, there is no option but for the Bollinger Bands to contract. This signals the start of a price swing after the breakout.
Note: be careful here. There is potential for a fake-out.
Wait for a trend to be confirmed before jumping in. Getting the direction of the trades correct will serve you well.
Here is an example from Dynamic Trend:

If there is a fake-out, you should notice that prices and overall trade volume will break.
Some traders may take an immediate short position after the breakout because of the low volatility during the squeeze. Ideally, you should be waiting to see what happens but if you’re a riskier trader you can make quick gains before the break,
If you do plan on taking an immediate short, wait for the price to come back within the Bollinger Bands, check there are some candlesticks with the bands that don’t break the first low. From here, short on the break of the low on the first candlestick.
Bollinger Bands work best for Forex
This is hands down the best market for using Bollinger Bands. If you’re thinking about using them anywhere else, just bear this in mind.
Because prices of currency move methodically, you can measure the bands much more accurately, meaning more reliable trades.
Bollinger Bands are purely indicators for measuring volatility; they aren’t a trading platform to buy your currency.
They react to specific price movement so if you’re still not too sure about how they work, scroll back and have another read. It’s fundamental, just like how you initially learned to pick up on various price patterns when you started out.
By doing this, you avoid finding many fake-outs and discover actual trading opportunities.
Conclusion
These are only some of many methods that Bollinger Bands are useful for. When it comes to Bollinger Bands, the first thing that should come to your mind is volatility.
The more volatile the market, the more likely a large swing looms. Bollinger Bands are a great way to identify these swings and ultimately make you money.
However, when you do research of your own, don’t just rely on what the Bollinger Bands are telling you.
Incorporate other trading strategies and indicators to make sure what you hypothesise is correct.

Tom is the owner of Elite Forex Trading. A website that provides beginner tips, trainings, reviews and strategies to help newbies get started making money in the forex markets.