We have been on the topic of forex indicators of late. So, sticking with this theme, this post will be looking at the MACD.
Beginners to forex will find this indicator very friendly and can apply it to other strategies they will learn along the way to becoming a forex trader.
We will be focusing on what the MACD is and then go on to describe how to use it as part of a few trading strategies.
Table of Contents
What is MACD
The Moving Average Convergence/Divergence, usually just referred to as MACD, is a lagging indicator that measures the relationship between two exponential moving averages (EMAs).
MACD is made up of 3 components:
- The faster moving average
- The slower moving average
- The histogram
Here is an example from Trading View to help see what this looks like:
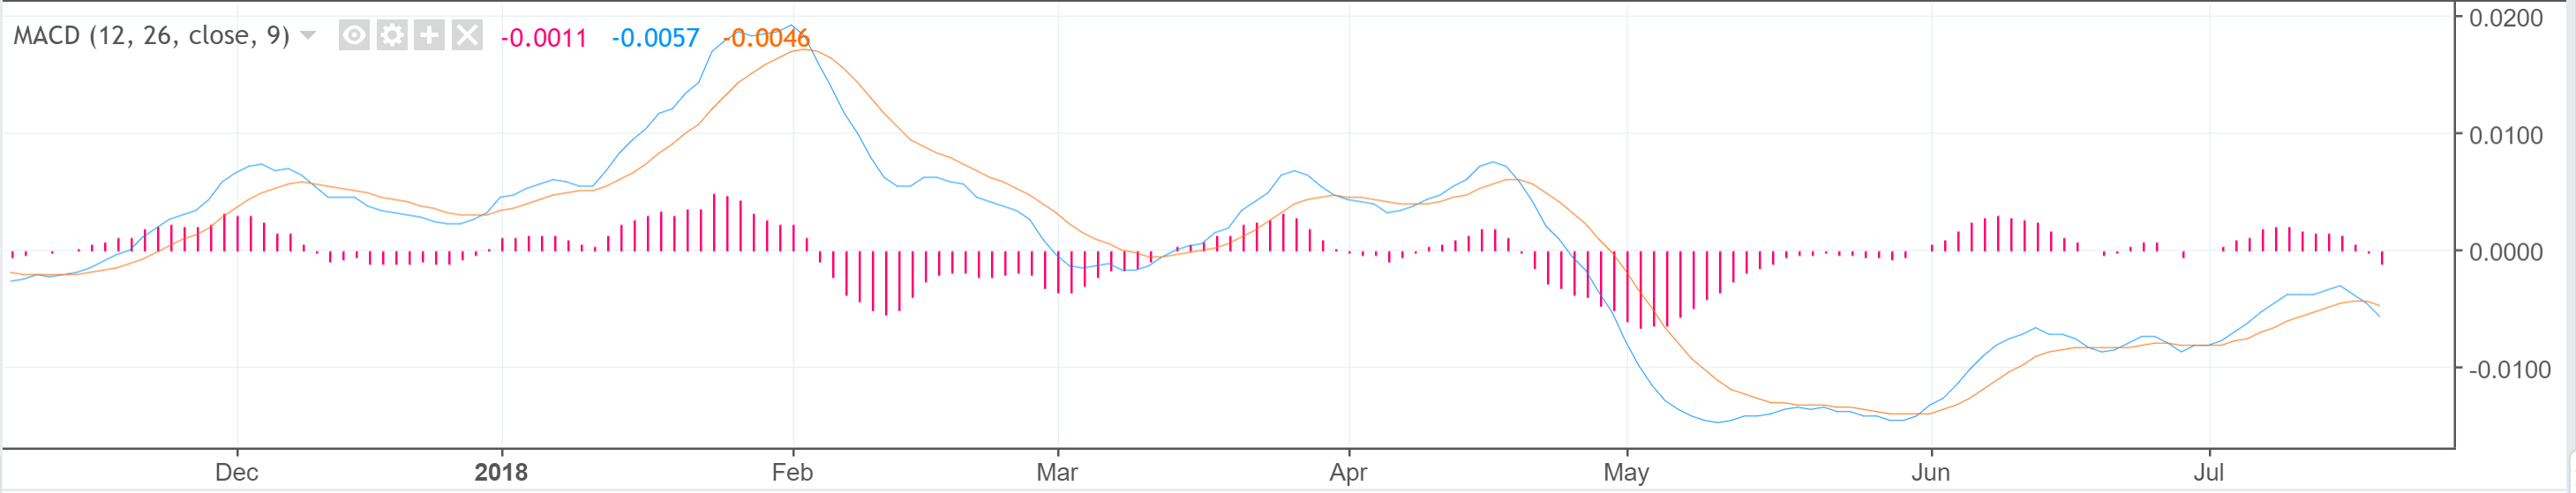
As an FYI:
- the MACD line is the faster moving average, represented by the blue line,
- the signal line is also the slower moving average, represented by the orange line,
- the histogram is represented by the red bars.
MACD inputs
There are a few inputs that are commonly used for forex trading. Its default values are the 12, 26 and 9 periods.
The way you enter the indicator inputs are simple: enter the fastest moving average first, then the slowest and finally the input of the signal line, which we will look into in a minute.
The MACD line itself is calculated by
12-period EMA – 26 period EMA.
This period will represent the time period of your choosing, for example a 5-minute period or a daily period.
One of the most important features of MACD is the ‘0’ line. You can see this line in the first chart above.
This shows a trader when the fast moving average intersects the slow moving average.
Example
Let’s quickly focus on a market experiencing a downtrend:
Faster moving averages will travel down faster than a slower moving average.
As the quicker moving average moves away, ie diverges, from the slow moving average, MACD will show this happening.
The same goes for a market experiencing an uptrend.
Faster moving averages will travel up faster than a slower moving average.
As the quicker moving average diverges from the slow moving average, MACD will show this relationship.
MACD helps forex traders identify changes in a trend early on.
The signal line
So as we have just discussed, MACD is useful for discovering changes in trends early on.
However, it would be impractical to just rely on the fast moving average to intersect the 0 line. We are going to need more than that.
Enter the ‘signal line’.
The signal line is a moving average on the same period value of the MACD line. For example, if MACD was set at 20-period, the signal line would also be set as 20-period.
The reason for this is because it creates a trade opportunity when the MACD line crosses the signal line.
If the MACD line crosses above the signal line, forex traders will be looking to buy.
Likewise, if the MACD line crosses below the signal line. forex traders will be looking to sell.
Above = buy, below = sell
However, this shouldn’t be taken as gospel. Especially for you new or inexperienced traders, always look to use another indicator before entering a trade.
MACD histogram
This is another technique that requires looking at the 0 line (you can probably tell by now that it’s important). The histogram is a series of bar chats that are plotted along the 0 line.
Forex traders can use the histogram to follow the relationship between the MACD and the signal line. When MACD crosses the signal line, the histogram crosses the 0 line.
If the MACD line crosses above the signal line, the histogram will follow suit and cross above the 0 line.
If the MACD line crosses below the signal line, the histogram will cross below the 0 line.
Distances between moving averages
Unlike how we saw in the previous Bollinger Bands article, the MACD indicator does not any and upper or lower limits. This usually leaves traders thinking it can’t be used as tool to detect if currency is being oversold or overbought.
However, MACD can be used to do this by measuring the distances between the fast and slow moving averages.
The easiest way to identify a divergence is by comparing them against the bar heights on the corresponding histogram.
This divergence can lead to sharp rallies counter to the preceding trend. You will be able to notice the signs of this happening on your charts because they will be in a teacup formation.
If you are to use MACD for identifying overbought or oversold currencies, you must have strict stop losses in place.
MACD to detect trend changes
In order to find the biggest trend changes, you are going to need to take a step back or two from your usual trading periods.
Usually, you should be looking to go 2 or 3 time further away. The broader the scale you look at, the easier it’ll be to spot trend changes.
For example, if you trade looking at 1-day charts, you should zoom out to 3-day charts to spot large trend changes.
Something that you will notice: when a price comes to the end of a trend and reverses, check what happens with the MACD when it retests.
Hopefully, you will see that that it will continue to follow the new trend and not follow the lower low during the retest. This divergence may result in long lasting trends.
The thing to predicting large trends is using the MACD and looking at past readings.
But, importantly, just because something happened in the past does not mean it’ll be the same in the future.
How to trade using MACD
Before getting into some specific trading strategies, I wanted to give some generic pointers om how to trade using MACD.
Taking profits
You should be looking to hold on to your currency until the MACD gives you a clear signal that a trend is changing imminently.
Once you see this change, you should be exiting your trade.
Stop losses
To protect your position, you should use stop losses. We always recommend that you implement them into all your trading strategies.
For a buying position, look to place a stop loss below a previous bottom. For a selling position, look to place a stop loss above a previous top.
If your trades exceed these points, you will exit a trade automatically. And you know what, that’s ok
The last thing you want to doing is chasing losses, end up just gambling and annihilating your bankroll. Managing your bankroll properly is really important.
MACD trading strategies
So now we know how to use MACD it’s time to put it into practice into a series of trading strategies. All chart I have taken courtesy of the free tool Trading View.
Money Flow Index strategy
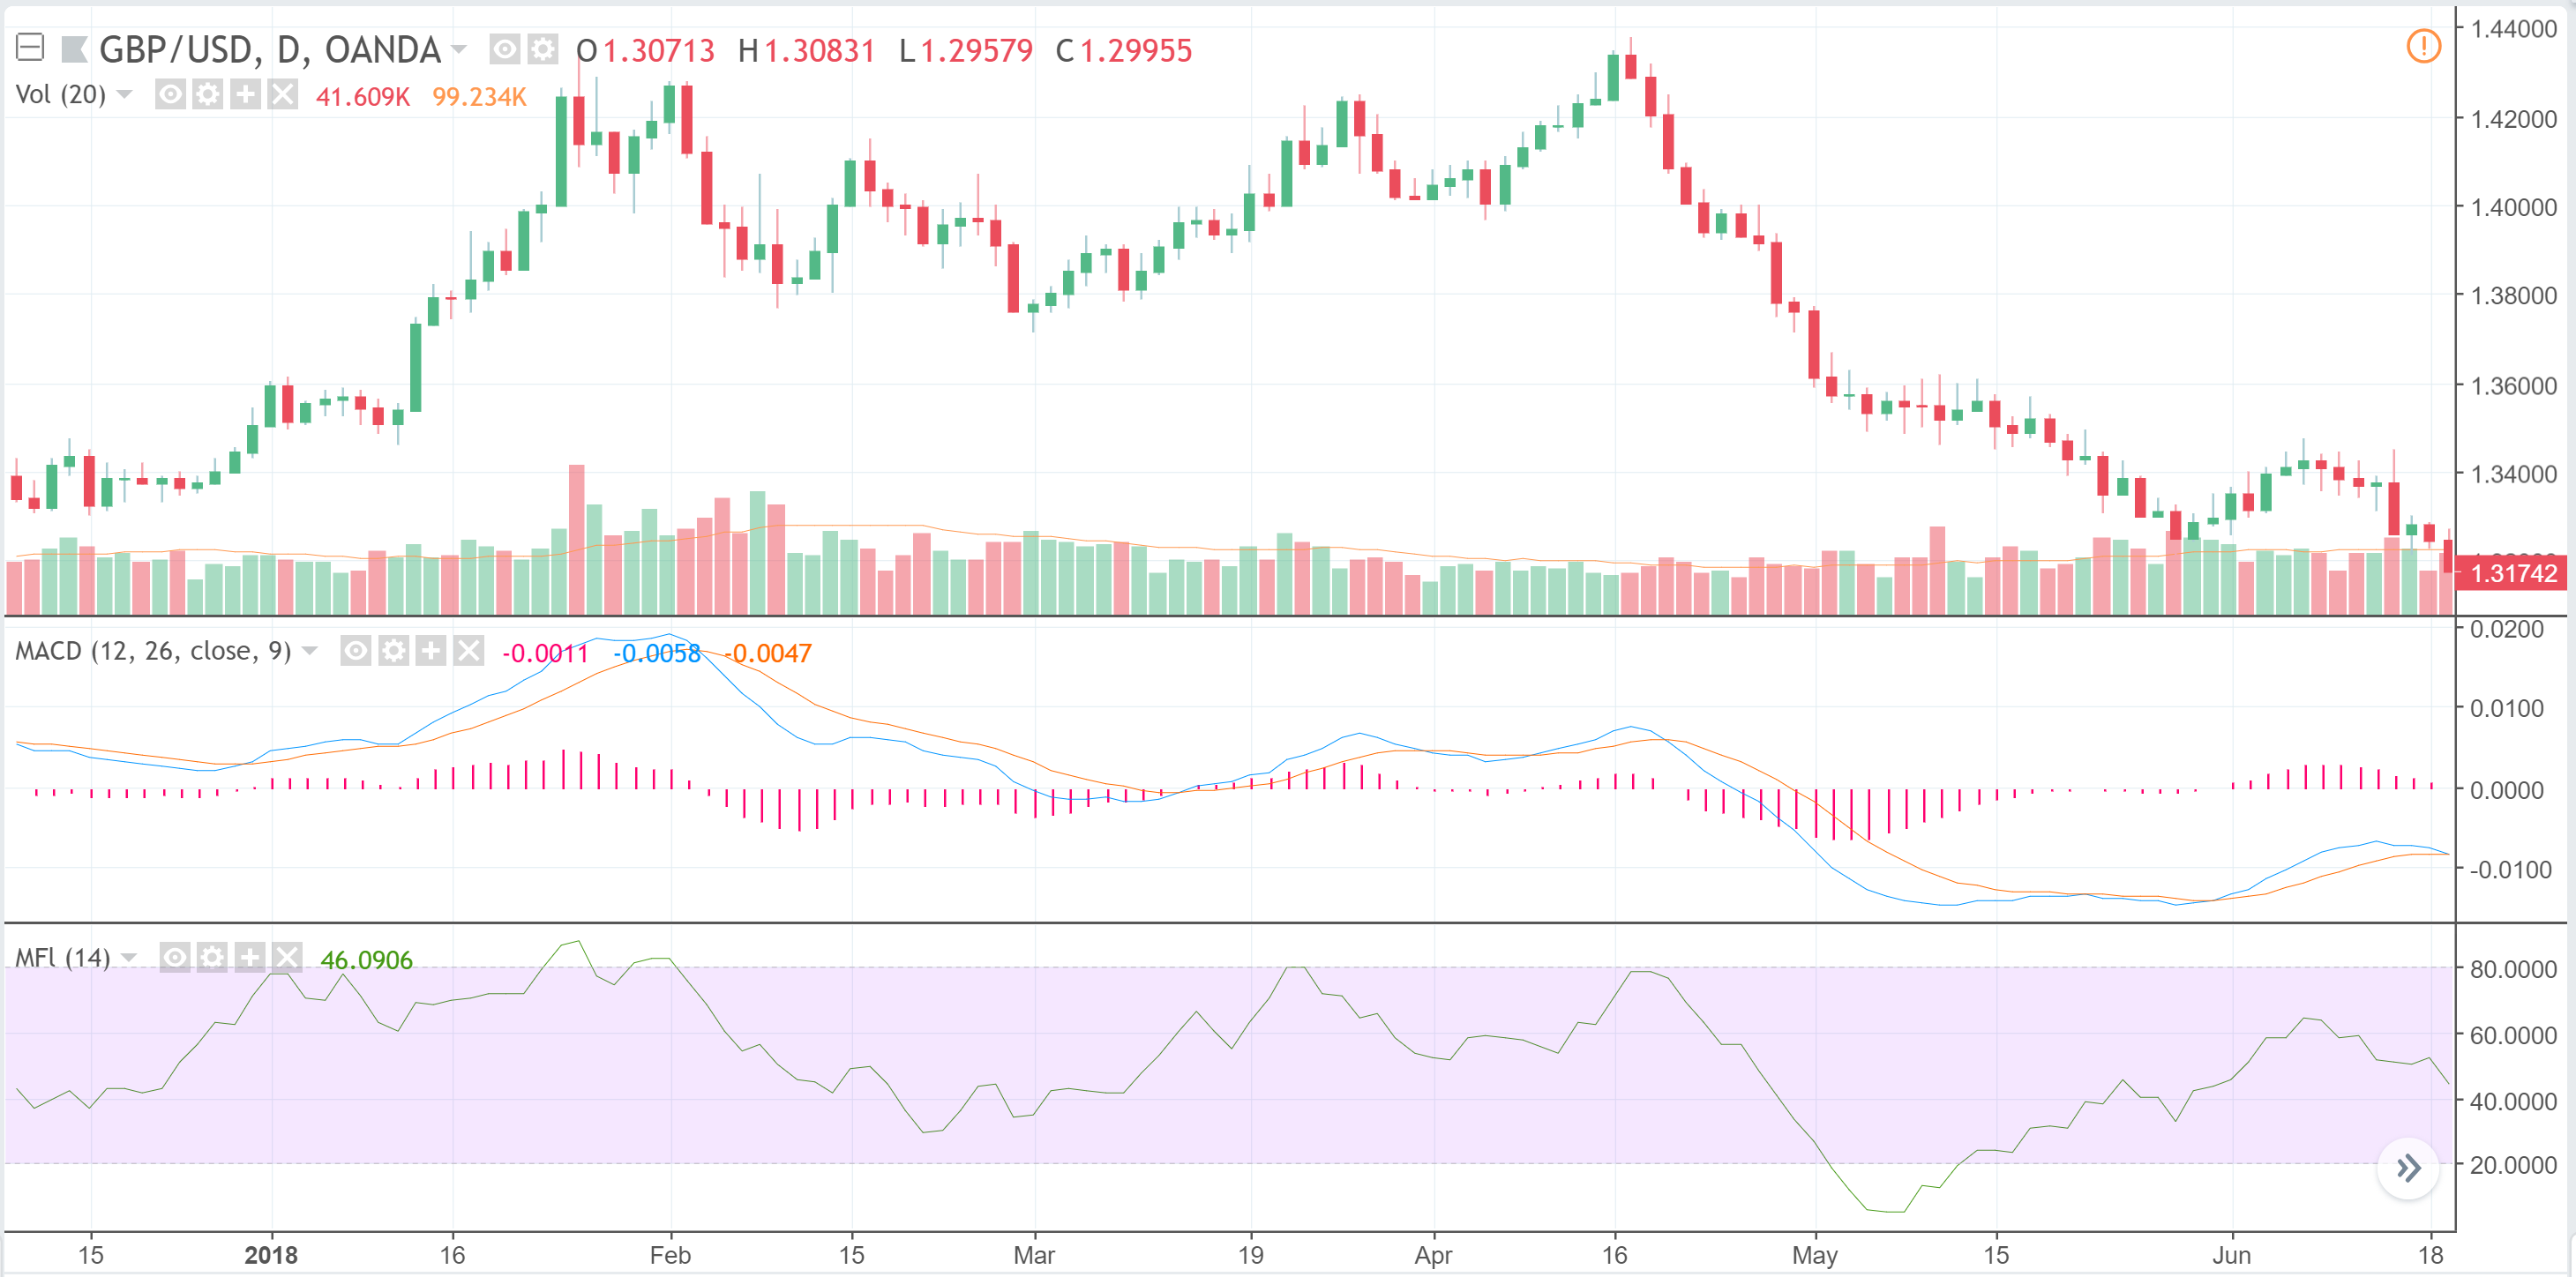
The Money Flow Index (MFI) is an oscillator, rather than an indicator, that focuses on the currency prices and trading volume.
The benefits of osscilators is that they provide a better understanding of whether or not has been overbought or oversold. The MACD will then confirm if the strength of the suggested trend is maintained.
MFI needs information on how the price actions are moving in relation to the volume of trades being place in order to show the greatest readings . This means that you are less likely to see buy or sell signals compared to other oscillators.
This strategy combines MACD crossovers with overbought or oversold signals produced by MFI.
The concept is as follows:
When the MFI tells you that currency has been overbought, you should wait for the MACD line to confirm a downtrend by crossing below the moving average.
If this happens, you should short.
The method is the same for when the MFI tells you that currency has been oversold. You should wait for the MACD line to confirm an uptrend by crossing above the moving average.
If this happens, you should long.
Once you enter the trade, you should stay with it until the MACD line recrosses the signal line in the opposite direction. When this happens, exit your trade.
Relative Vigor Index strategy
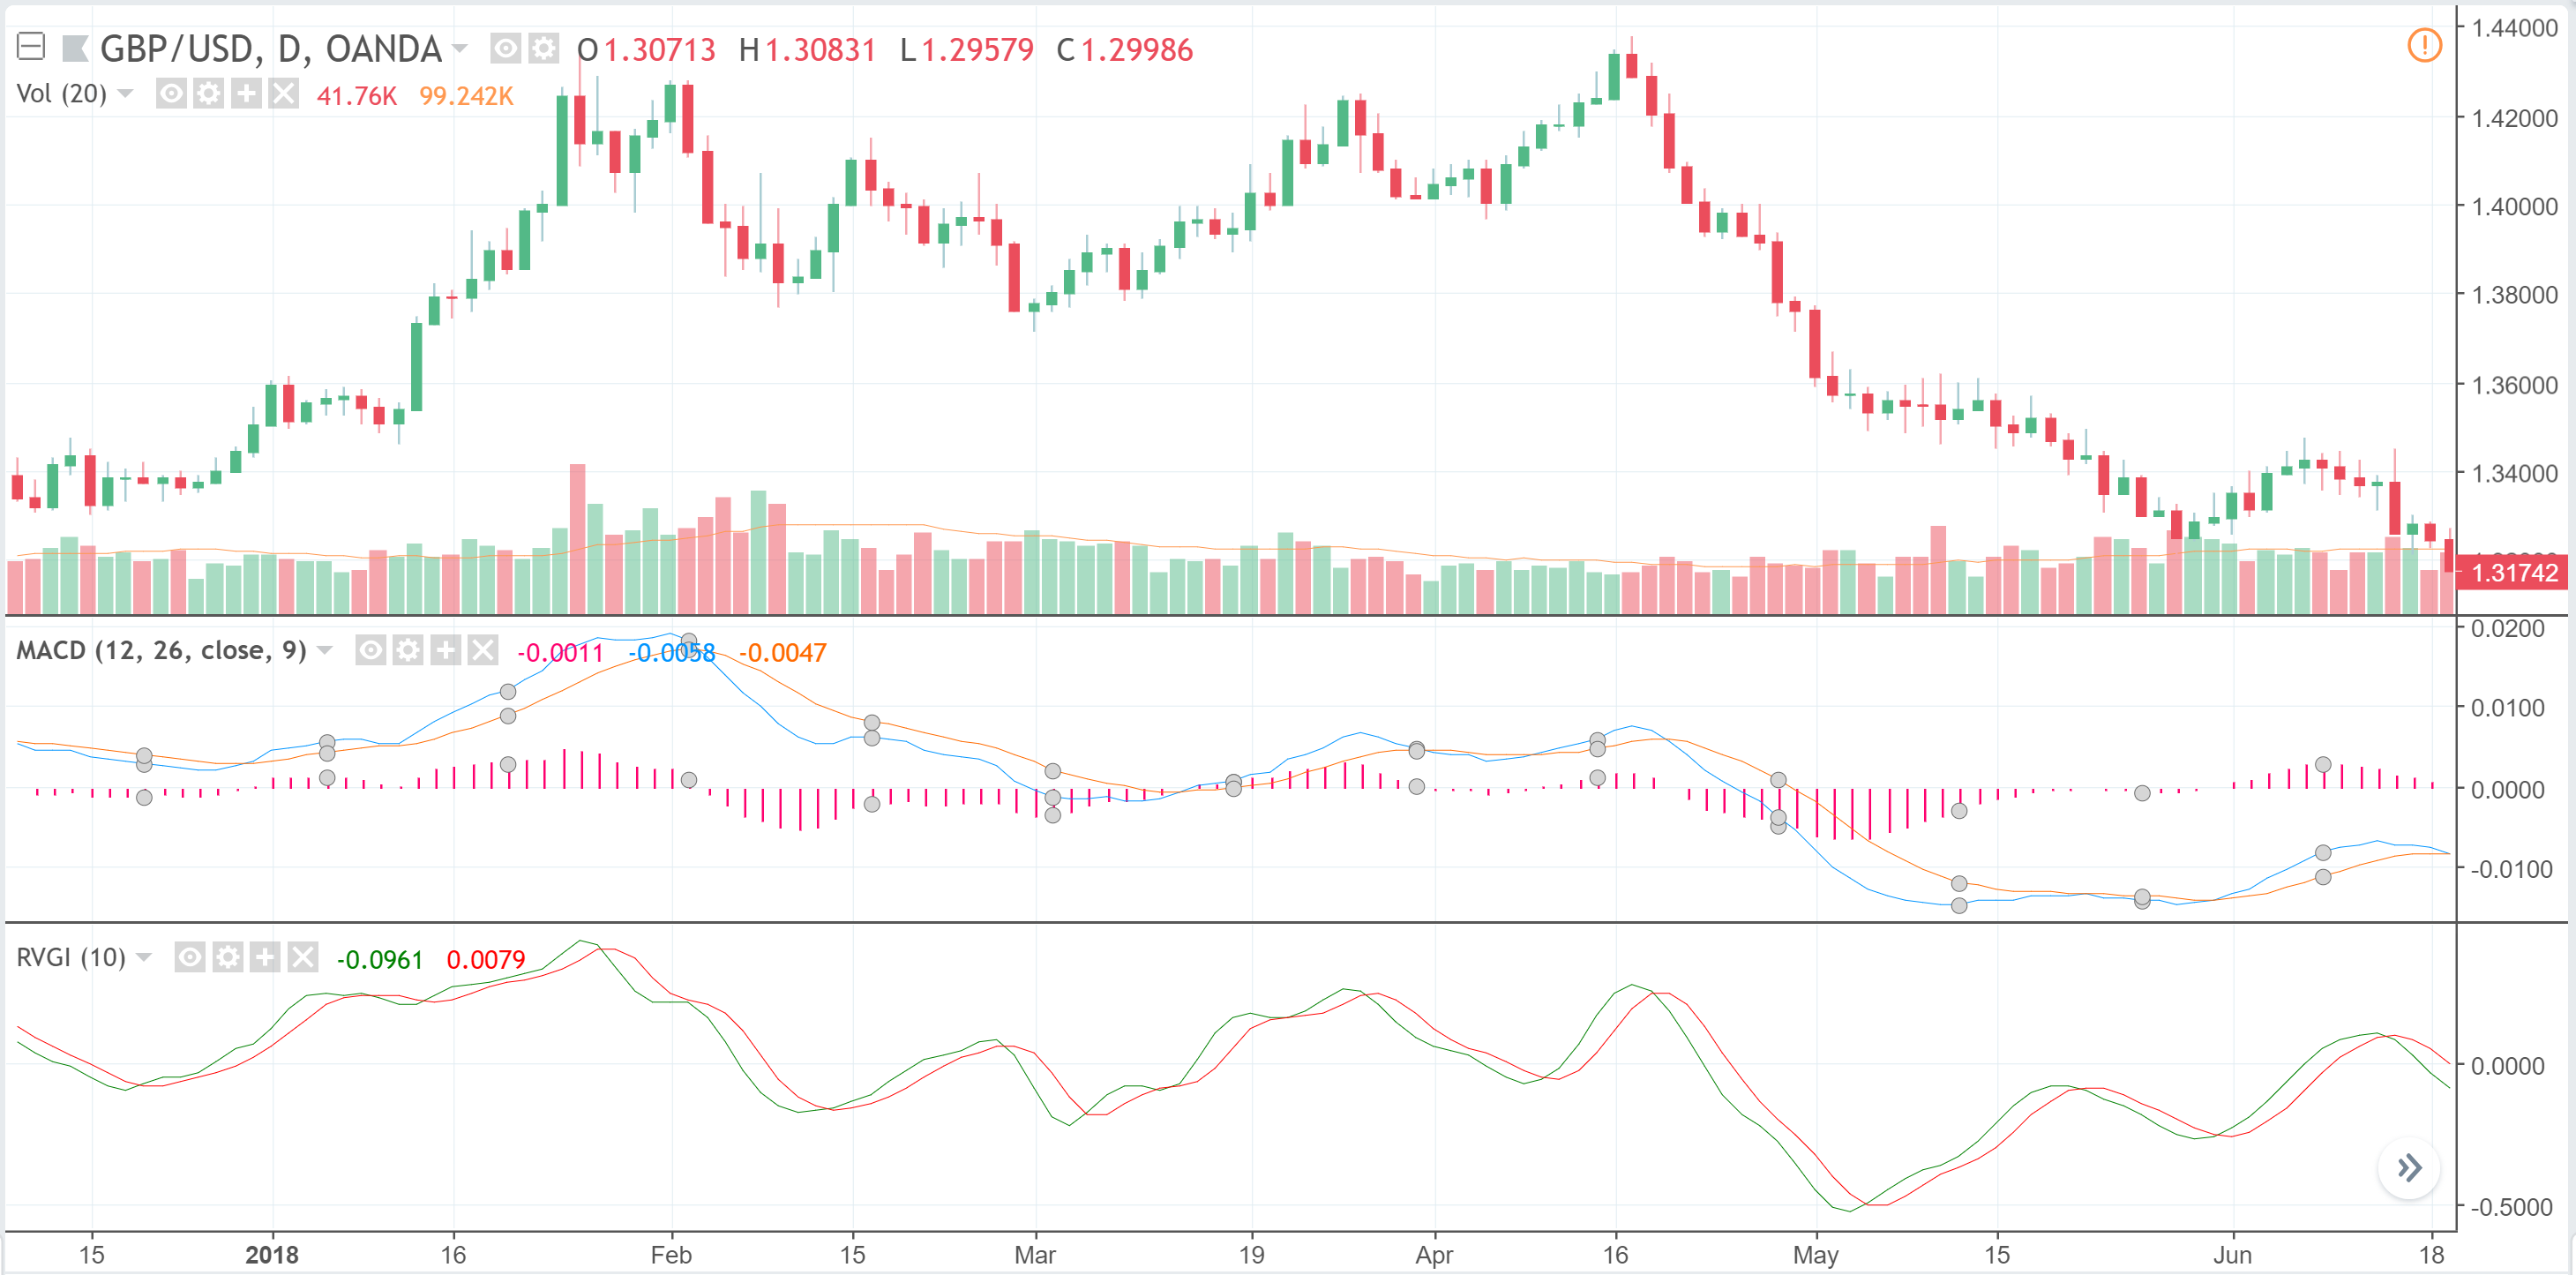
The Relative Vigor Index (RVI) is another oscillator but instead of focusing on price on volume, focuses on it’s closing price compared to its overall price range.
When using the RVI, the idea is to combine it with the MACD and match the crossovers together.
If the MACD crosses below the signal line, you should wait until the RVI also crosses in the same direction.
You then make a trade based on this happening and then selling your currency once when the MACD confirms a trend reversal and so you sell.
Awesome Oscillator strategy
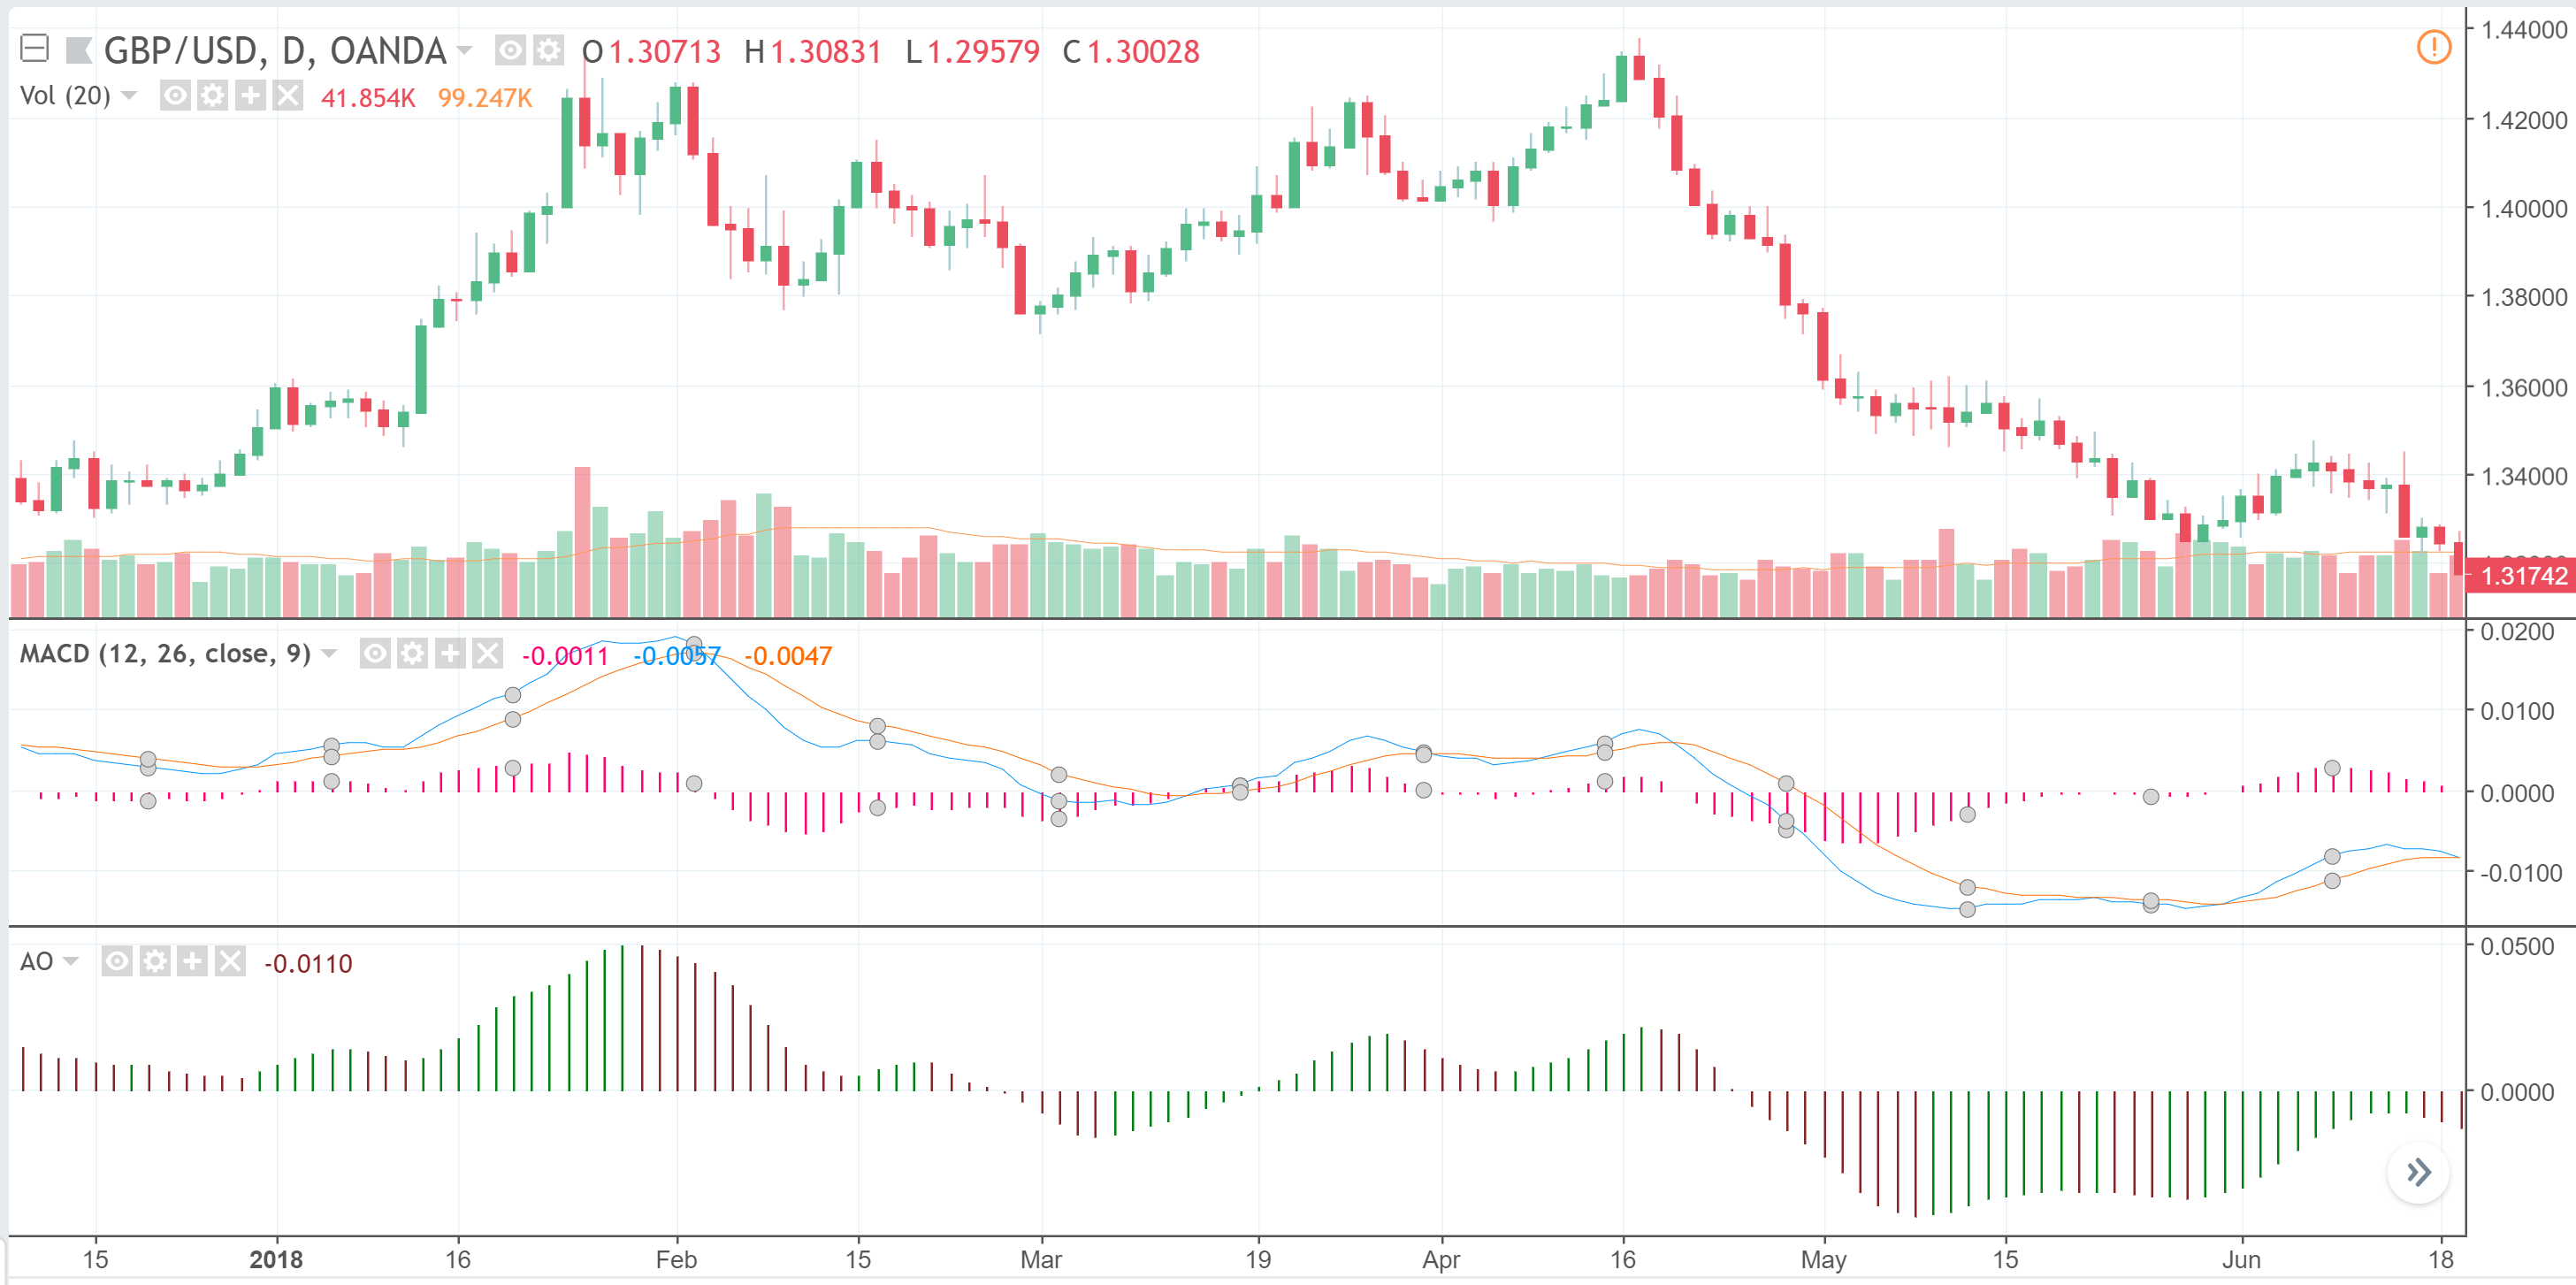
As you can tell by the name, this is yet another oscillator strategy. The Awesome Oscillator (AO) is used to measure momentum in the markets.
AO calculates the difference between a 34-period simple moving average and a 5-period simple moving average.
It is used to confirm trends or predict any imminent reversals.
This strategy is fully dependent on what the MACD is signalling. You should be looking to enter and exit when a trend has been confirmed or a reversal is incoming.
There may be times where you enter a trade but all of a sudden, the AO will give a signal that suggests the opposite of what you originally saw.
If this happens, pay attention the MACD line. If it does not crossover the signal line, then you can be confident in your initial prediction and so stay in your trade.
Exit the trade once the AO generates the trend reversal.
Triple Exponential Moving Average strategy
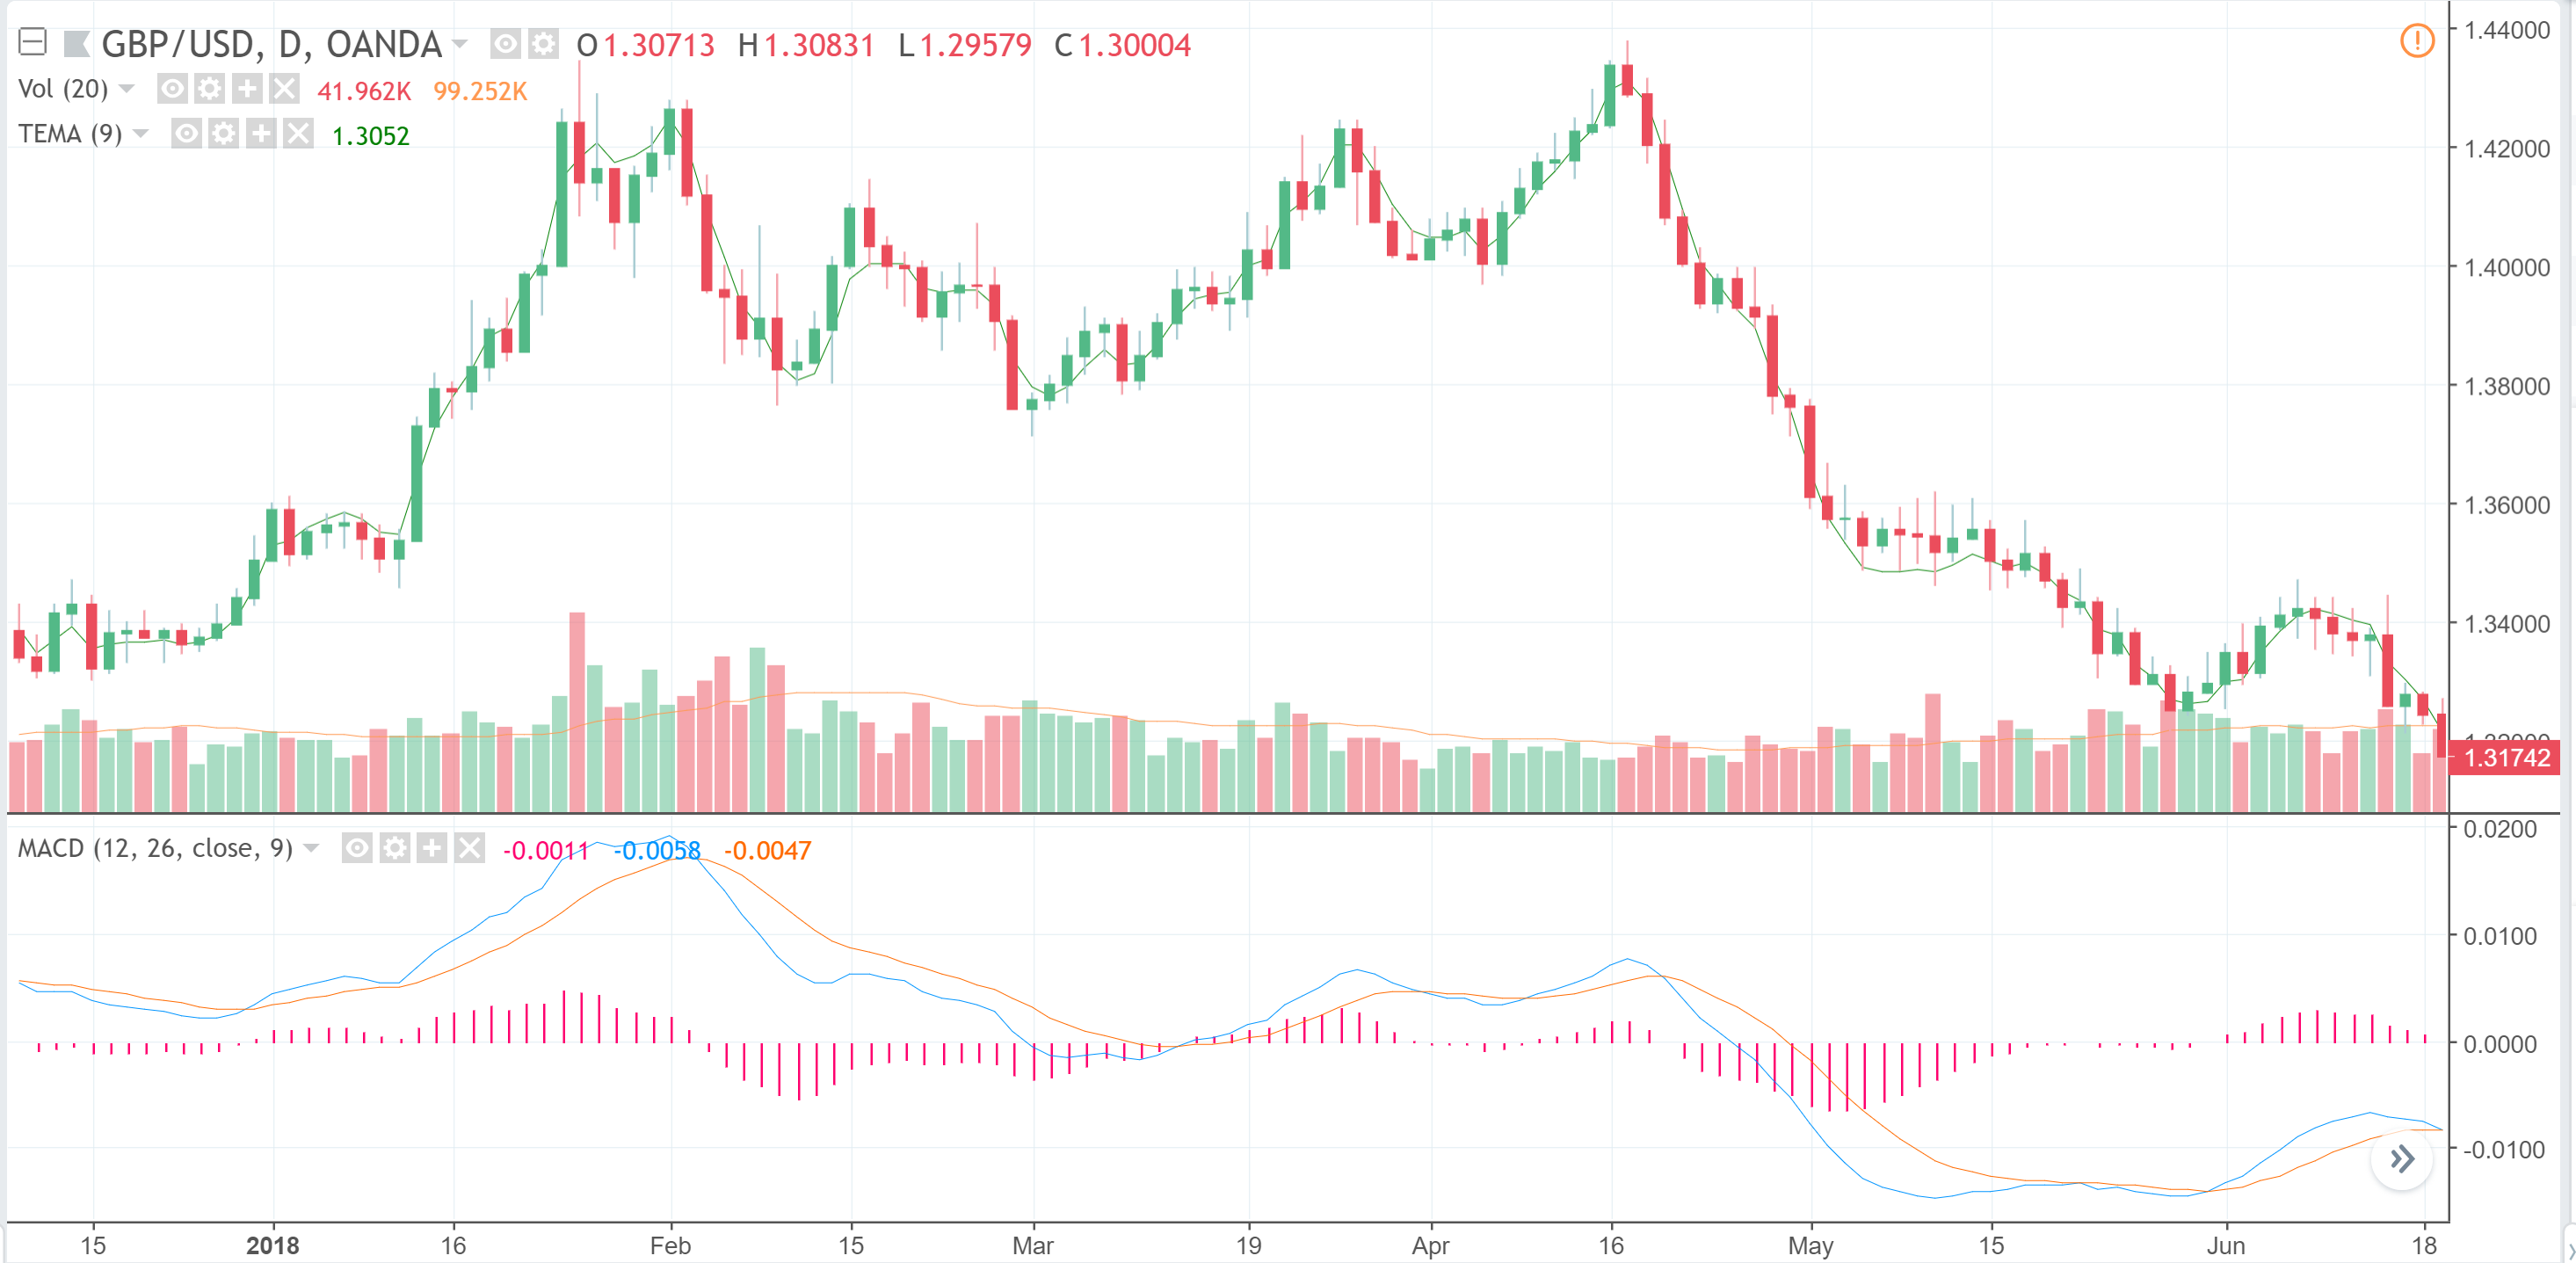
The triple exponential moving average (TEMA) indicator requires using three exponential moving averages (EMAs).
TEMAs are built as follows:
- A single EMA is used to calculate price actions;
- A second EMA is used to measure the movement of the first EMA;
- A third EMA is used to measure the movement of the second EMA.
This where the name comes from.
TEMA is used for identifying trends in the market.
You will see that trade signals are made once the fastest of the three EMAs cross the MACD line and currency prices crosses over the TEMA. Depending on what direction the price breaks through this line determines whether you are buying or selling.
If the forex price closes below the TEMA line, a selling signal is generated. If the forex price close above the TEMA line, a buying signal is generated.
TRIX strategy
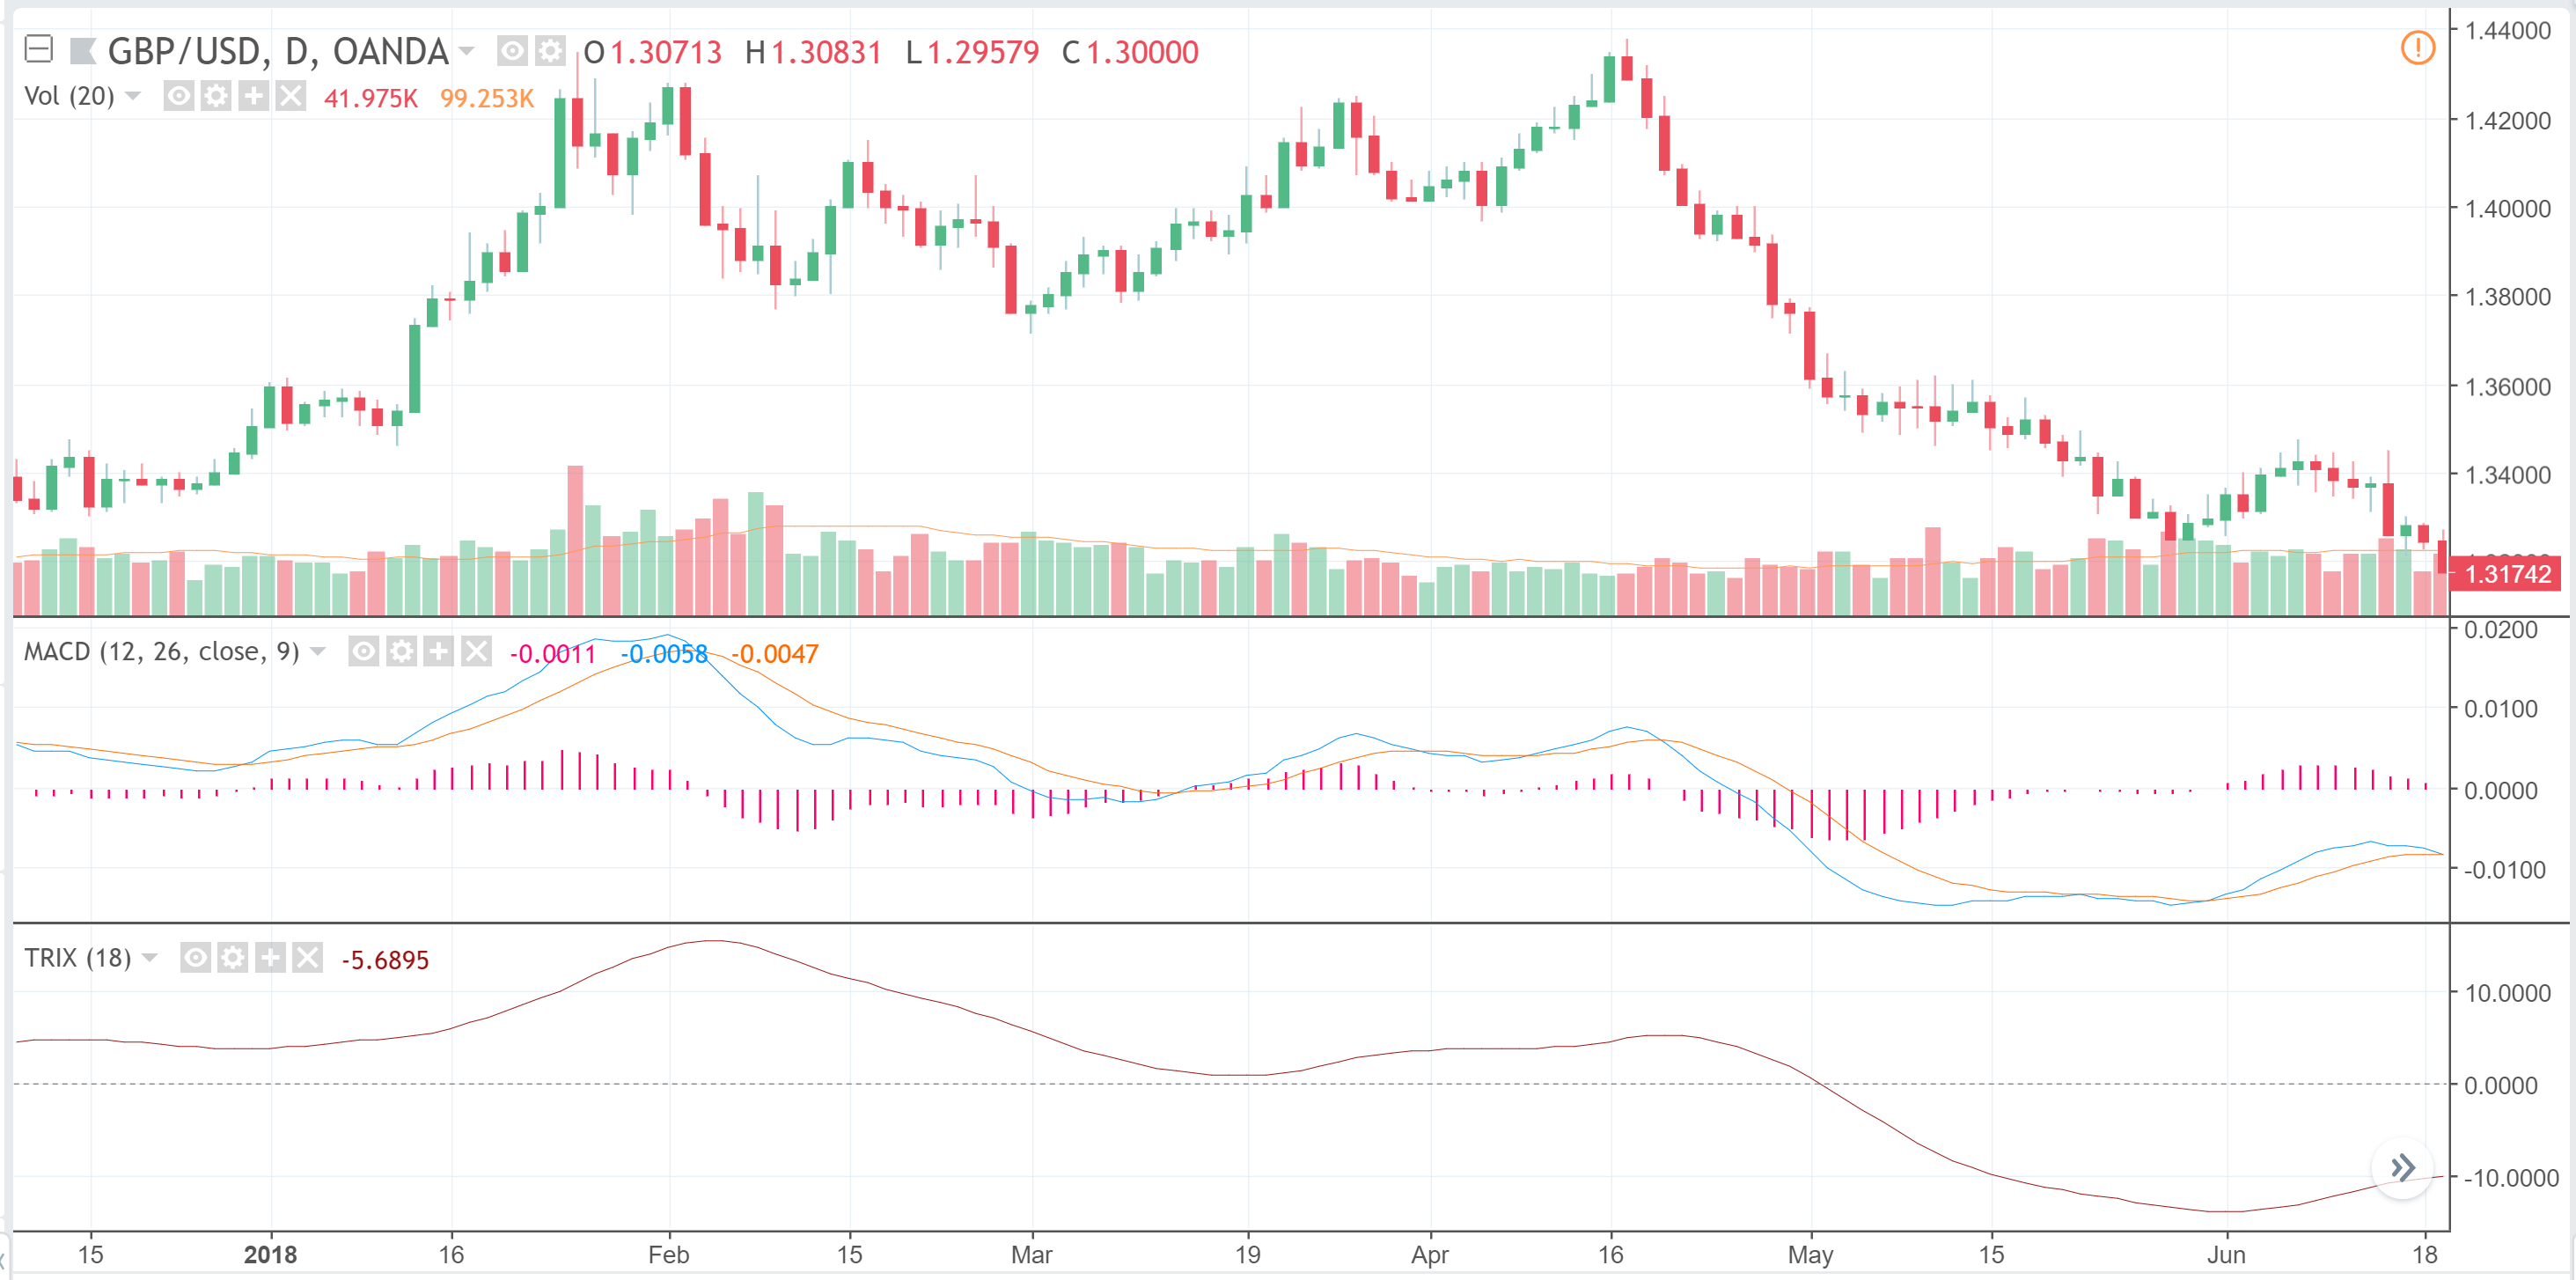
This is built upon similar concepts to the TEMA indicator. However, it’s important to know that TRIX is an oscillator rather than an indicator.
TRIX essentially shows the percentage change of the TEMA. This is shown as a aline of the indicator itself and measures the momentum.
The simplest trading single that TRIX gives us is when it crosses above the 0 line, go long, or if it crosses below the 0 line, go short.
So, applying this to MACD:
You are going to be matching corresponding crossovers of the MACD line with TRIX crossing the 0 line.
When these two match together, you enter a trade and wait for prices to trend in a the direction you have predicted.
However, these gives us more than one exit strategy.
- You can exit a trade once the MACD line crosses back over the signal line, or
- You can exit a trade once the MACD line crosses over the signal line AND the TRIX crosses over the 0 line.
Option 1 tends to be a much safer exit strategy because you will be exiting your trade straightaway, whereas option 2 is slightly more risky because if trends change, you could be locked in the trade for a while until the TRIX eventually crosses the 0 line.
The choice depends on your trading style; option 1 isn’t significantly better than option 2 or vice versa.
Conclusion
So to sum it all up, MACD is an indicator used to discover upcoming trends and signify the end of a current one.
MACD is made up of three components: the faster moving average ie the signal line, the slower moving average and the histogram.
It is best paired with the strategies we have described above and when used correctly can bring you great profits.
If you haven’t already done so, check out our free ebook or if you’re looking for an advanced course to increase your income, we have that covered too.

Tom is the owner of Elite Forex Trading. A website that provides beginner tips, trainings, reviews and strategies to help newbies get started making money in the forex markets.