
It is likely that you have used the Fibonacci retracement to compliment other forex trading strategies or to confirm key market levels.
The Fibonacci retracement is used to identify major market tops and bottoms by using support and resistance levels.
By the end of this article, you will able to go and confirm potential market tops and bottoms yourselves! This will be incredibly useful for any trading method you use and comes with the potential to make very large profits.
Get your pen and paper out and pay attention.
Table of Contents
Who was Fibonacci?
He was a very clever guy. Fibonacci was an Italian mathematician born in the 1100s (the exact date is actually unknown).
He developed the Fibonacci sequence which is widely considered to be his best ever achievement. Some of the uses of Fibonacci number can in fact be found in the natural world, such as predicting the chance of a honey bee being born a male or female.
The Fibonacci Sequence
For those of you that are unaware, the Fibonacci sequence is a series of the following numbers:
0, 1, 1, 2, 3, 5, 8, 13, 21, 34, etc.
You may have seen images similar to the picture just below. 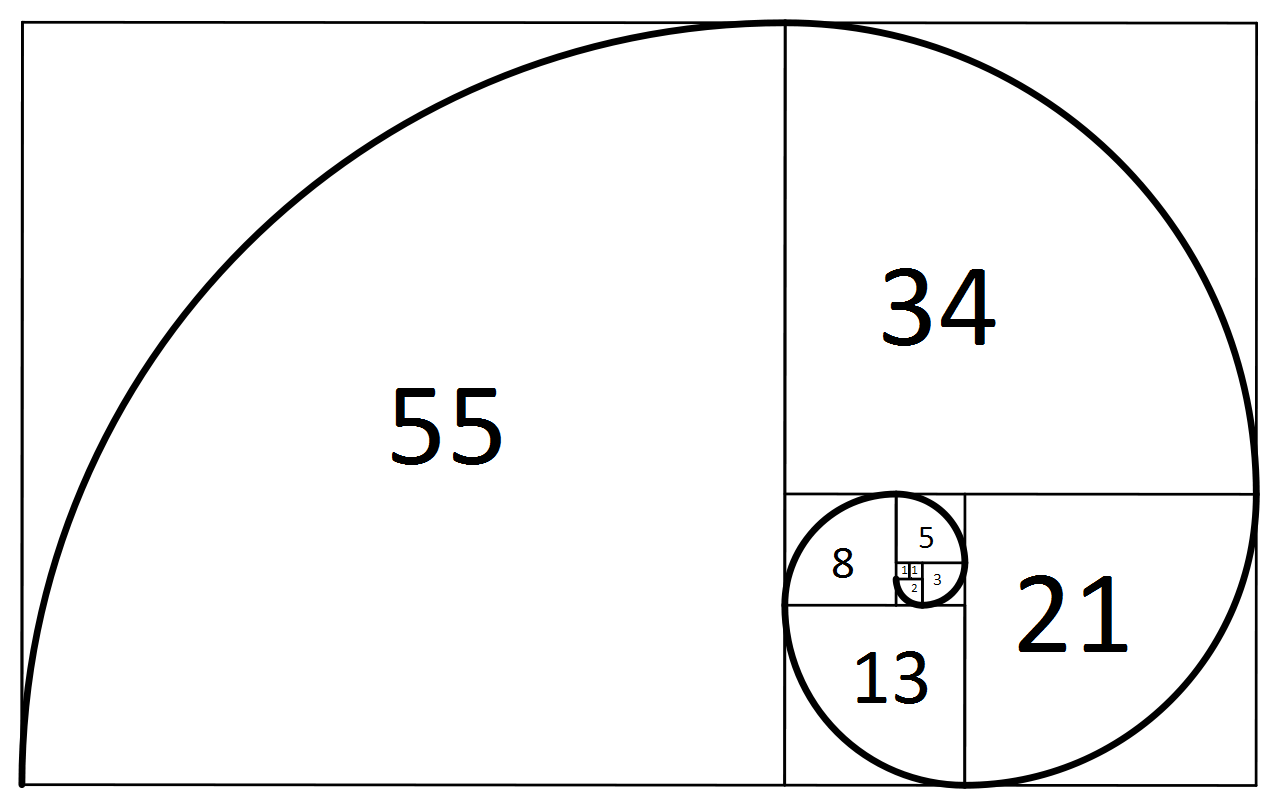
It starts at 0 and 1 and every number after this is produced from the adding the previous two numbers together. 0+1=1 so that’s the third term, 1+2=3 so that’s the fourth term, and so on, you probably get the idea by now.
However, what is really interesting about this sequence is not how the numbers are produced from addition, but rather multiplication.
Diving in a little deeper into the series, we can find that each number is roughly 1.618 times larger than the previous. This common relationship forms the basis of the ratios used in retracement.
61.8% is known as the ‘golden ratio’ and is also called the Fibonacci ratio. You can see it for yourself: 13 divided by 21 =0.6190, 21 divided by 34 = 0.6176.
Using this knowledge, what is relationship between one number in the sequence and the number that is two places to the right?
8 divided by 21 = 0.381, 13 divided by 34 = 0.382.
This is where the 38.2% ratio is born. For those of you good with maths, adding 61.8 and 38.2 together gives you 100%…
So we have these two Fibonacci ratios: 61.8%, and 38.2%.
Some of you may have some background knowledge and are wondering about why we are not using the third ratio of 23.6%. Well, for forex trading, this is not needed.
Rather, we use a 50% ratio instead. This is a direct Fibonacci number but because of its ability to create large success with this method. This is specific to the forex markets due to to the market retracing around half a major movement before continuing the trend.
So we altogether we have the following ratios: 61.8%, 38.2& and 50%
These all play a big role in the forex markets and can used to find the key points where the price could potentially reverse. If a price action retraces to one of the three ratios above, it is likely that the trend will continue in that direction.
This is known as the Fibonacci retracement.
The Fibonacci retracement
This is what it looks like on a chart:
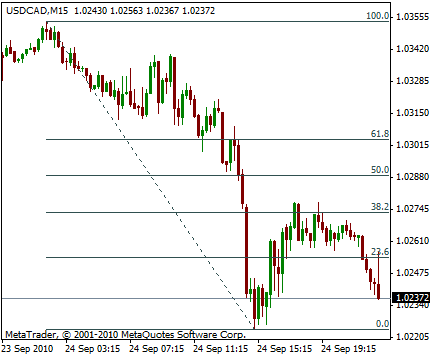
As you can see, we have the 61.8, 50 and 38.2 ratios. In this example, the price moved about approximately 38.2% of a move down before continuing.
So now we know what it is, how can we use it to make money?
Forex trades use Fibonacci retracements to spot position orders when entering the market by either taking profit or stop-loss orders.
The retracements are important in identifying the key levels of resistance and support in the market.
For best practice, forex traders implement this strategy when the markets have experienced large movements, including bullish and bearish swing trades, and then proceed to stabilise.
Traders then use the ratios described above to map out Fibonacci levels.
Most trading platforms will have Fibonacci within their available tools but for traders that choose to do it manually, they draw horizontal lines across their charts at these precise price points. These pin point where possible retracements could happen in that market, before returning to original trend direction after the big movement.
Forex traders use Fibonnaci levels in the following strategies:
- Buying near the 38.2% retracement with a stop-loss order just below the 50% level.
- Buying near the 50% level with a stop-loss order placed just below a 61.8% level.
These are usually placed on either 1 hour or 4 hours charts that span over a couple days.
Retracement levels give places where the market could potentially reverse when it returns. We must keep an eye out for any signals that price actions give us when the markets hit these levels. This will give a good idea to whether the trend will reverse or not.
Rectracement levels are important
Fibonacci retracements are mainly used as part of a particular trend trading strategy. In scenarios like this, forex traders see a retracement occurring within a trend and consequently try to make low risk entries in the initial trend’s direction utilising Fibonacci levels.
This is pretty much saying that if you apply this method, the price should bounce back from the Fibonacci levels in the direction of the initial trend.
Retracement levels alert forex traders of signs that a trend is about to reverse or give alerts to potential support or resistance areas. Restracements are based on the original movement.
Once a pullback begins, traders can identify the Fibonacci retracement levels to find turning points. As the price begins to reach the retracements, prepare for a reversal.
Furthermore, the chances that the trend will reverse increase where signals converge before the price reaches the Fibonacci level.
It is common for other indicators to be used alongside Fibonacci levels, such as candlesticks and moving averages like the EMA. The more indicators that suggesting a reversal, the stronger the chance of a reversal.
Fibonacci retracements should be used over multiple different time frames. The longer the period you study and find appropriate levels, the stronger the indicator. For example, a 61.8% retracement on a 3 month chart is going to be much more reliable than a a single month.
Fibonacci extensions
Forex traders use Fibonacci retracements to predict potential ares of support or resistance with the aim of finding the start of a trend as early as possible.
When the forex prices retrace more than 100% of its earlier movement, a Fibonacci extension can be calculated. When used with other indicators, they are used to determine price targets and possible exit points for their trades in the corresponding trend direction. One of the most popular extension is the 161.8% level.
There also levels known as Fibonacci expansions which go beyond extensions.
The difference between an expansion and an extension is that you’re now using three key pivots in the market to find your target level.
For potential resistance or buy targets, you would draw from a major low to a major high back to a major low to get resistance. For potential support or selling targets you would draw from a major high to major low back to another major high from left to right.
In summary, if you’re using two points alone, you’re using retracements or extensions. If you’re using three points for your target, then you’re using expansion or price objectives. The common levels used for expansions are 0.618, 1.00, and 1.618.
Here is what a Fibonacci extension looks like (chart found from here):
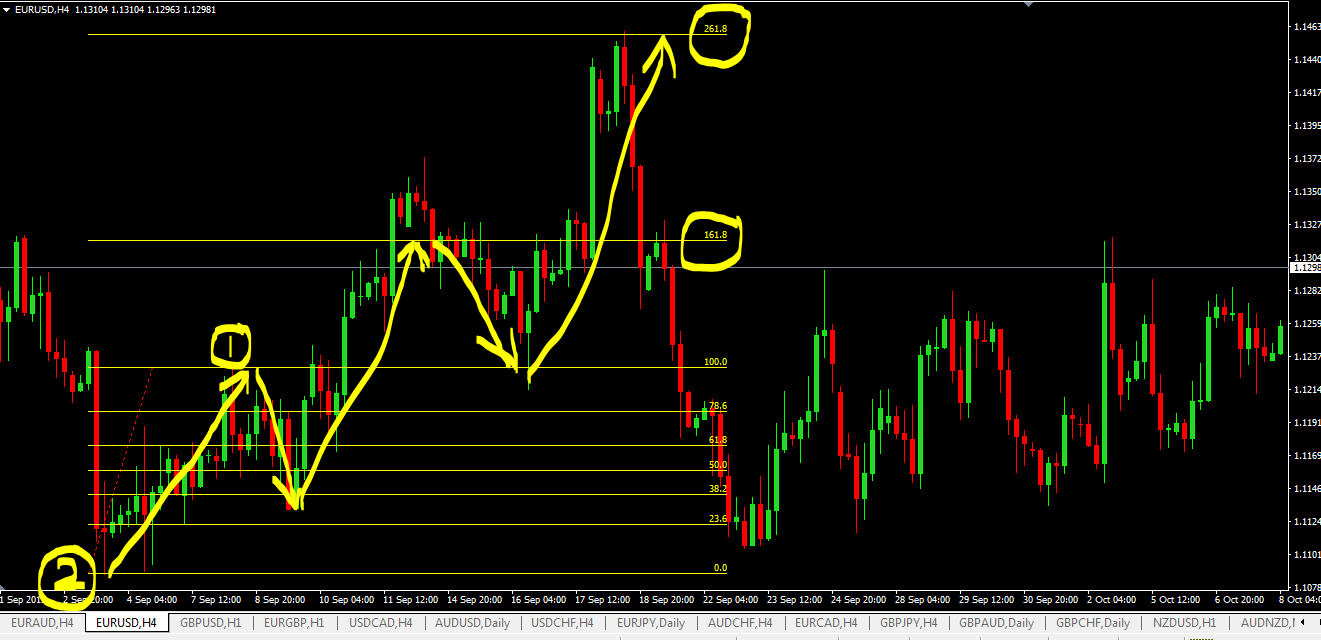
You can see the how the original uptrend has continued and broke through the high point and manages to reach the 161.8 Fibonacci extension. If predicted successfully, exiting the trade here will make a nice profit.
Trending markets
Depending on how long the market has been in a trend, you can determine which Fibonacci levels the market is likely to return at.
The longer the trend, the more unlikely it is that it will make a large pullback, unless the trend itself reverses. When drawing Fibonacci retracements on long-time trending markets, it is likely that the market will not come back to the upper Fibonacci level.
The most significant Fibonacci retracement level to be looking out for during the trends is the 61.8% level. This is usually the zone where you will find the maximum pullback. Investors will have feared losing and so end up selling which continues the trend.
Let’s look at a downtrend as an example.
Downtrend
Identify a dropdown, but once starts to fall, don’t jump in straight away. A lot of traders will end up jumping the gun and getting into a trade way too early. The downtrend might just be a mild retracement, it’s hard to tell at the beginning.
Fibonacci is able to get you into the trade once the trend has been confirmed. In the case of a downtrend, it is confirmed once you identify two or more higher-highs and two lower-lows.
Once you find the two lower-lows, bring out the Fibonacci tool. This will give you confluence.
Line up the previous high to the previous bottom.
If it is a downtrend, it will turn around once it hits between the higher 50% and 61.8% ratios.
Once the price enters this region, don’t trade. Wait for it to break below these ratios and enter the downtrend. Only then enter a trade on the price falling.
But this doesn’t unlock its true potential. Many traders stick to this and don’t take it any further.
The whole point of using the Fibonacci tool isn’t to find key levels, it’s to confirm they are present.
Turning points
Just a quick point, all diagrams have been found from Daily Price Action. I just want to run through a series of charts to really nail down what is going on here.
Take a look a section of this NZD/USD daily chart (I have zoomed in to give you the best view):
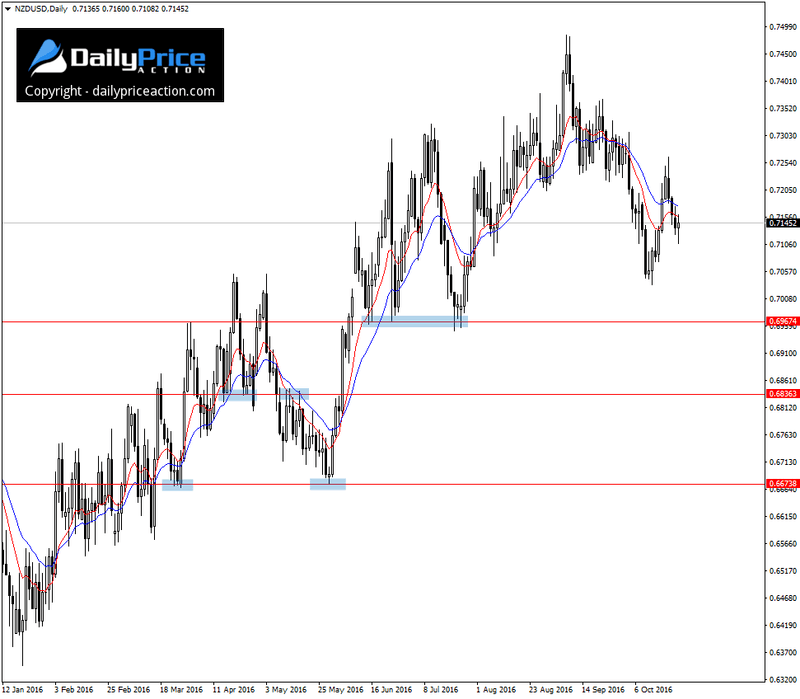
This chart shows a clear uptrend after May 2016.
Along the uptrend, notice how we see that there are a few critical support levels. Definitely worth watching.
Now we use the Fibonacci retracement tool to drag from the major swing low to the swing high. On the graph, we get something like this:
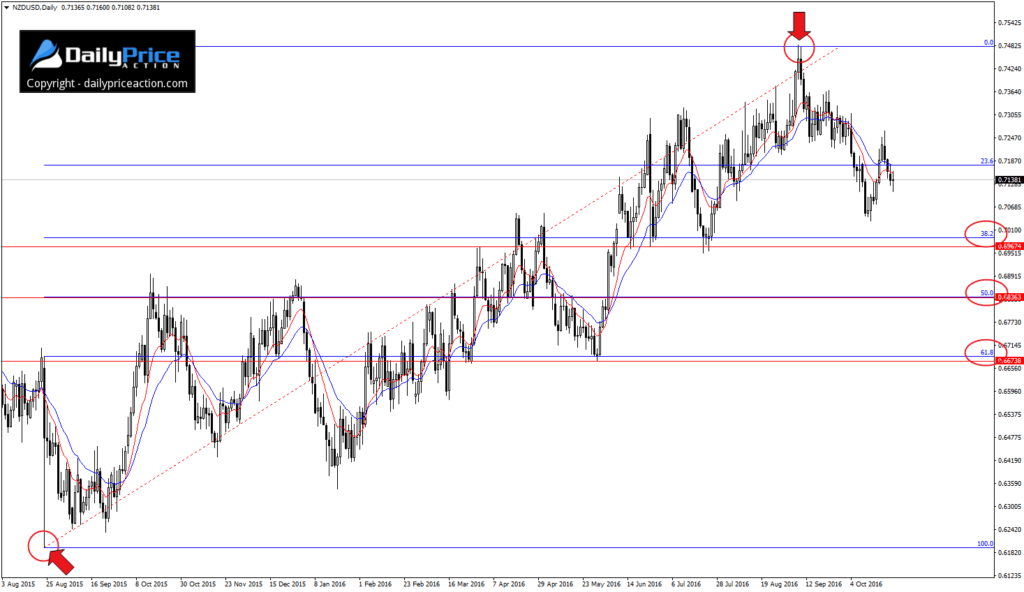
Look closely at the three circled levels. Notice anything special about these?
Each level we identified earlier line up with our Fibonacci ratios: 61.8%, 50% and 38.2%.
Not bad, not bad. We have discovered there is potential to take a buying position so we can make some money.
Here’s thing: most traders stop here. If you have been following us, you will know by now we are not most traders. We can take this even further and boost our returns.
Check this out (again, zoomed in to show you our specific point):

Notice how there is potential bearish position forming where the Fibonacci levels from top to bottom are lined up with our previous support areas.
What can we take from this? There is potential for a market top forming. This is because our Fibonacci levels will not line up with the support levels if the market exceeds the current high point.
By spotting this turning point, we are able to get a better grasp about what is going to happen overall; the ‘big picture’ if you will.
How to avoid false positives
A hurdle to overcome with all trading methods.
To get over this one, use this technique over a longer a higher time frame over an extended period. This basically means that you should be using weekly/monthly charts to identify start and end points and doing it over a considerable data set. We suggest a minimum of three years.
The more data that you use to find proof of concept, the more reliable your results are going to be.
Use this strategy in tandem with another in order to confirm your theories and prove your’re correct in your analysis.
Don’t just rely on one method as it could just be coincidence. A second or third strategy that backs up what you’re thinking is important to avoid false positives.
I must also say that the markets will not always resume their original trends after finding support or resistance but actually continue past the highs or lows.
This method will not guarantee you success like every other method but is a damn good strategy.
Conclusion
Using Fibonacci retracements to accurately mark reversal points are an excellent way to boost your forex profits. Successful analysis can help you identify potential tops and markets within the forex markets.
With that being said, use charts that are based over a long period of time to get the best and most reliable results.
If you want to learn about other trading strategies, check out our free ebook.
For those of you wanting to use forex as a method for long term passive income, our course will help you achieve your goals.

Tom is the owner of Elite Forex Trading. A website that provides beginner tips, trainings, reviews and strategies to help newbies get started making money in the forex markets.
